1、画出基本图
当图线中某些特殊地方需要标注时,我们可以使用 annotation. matplotlib 中的 annotation 有两种方法, 一种是用 plt 里面的 annotate,一种是直接用 plt 里面的 text来写标注.
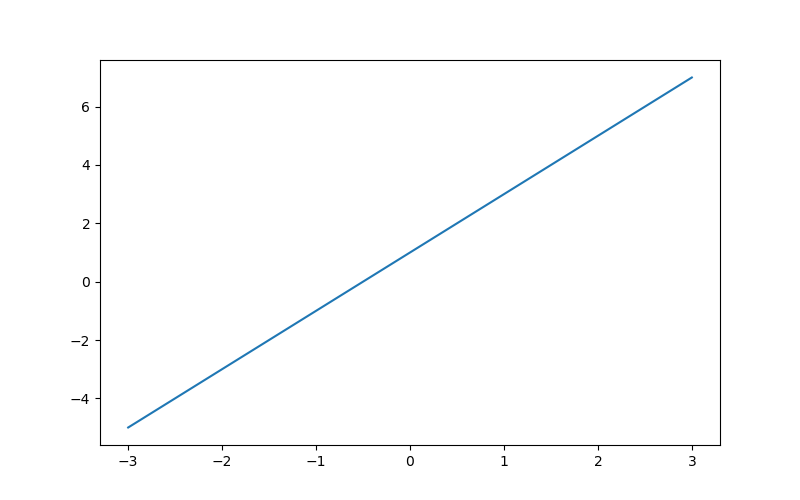
首先,我们在坐标轴中绘制一条直线.
>>> import matplotlib.pyplot as plt
>>> import numpy as np
>>> x = np.linspace(-3, 3, 50)
>>> y = 2*x + 1
>>> plt.figure(num=1, figsize=(8, 5),)
<Figure size 800x500 with 0 Axes>
>>> plt.plot(x, y,)
[<matplotlib.lines.Line2D object at 0x000001C38F2B4C88>]
>>> plt.show()
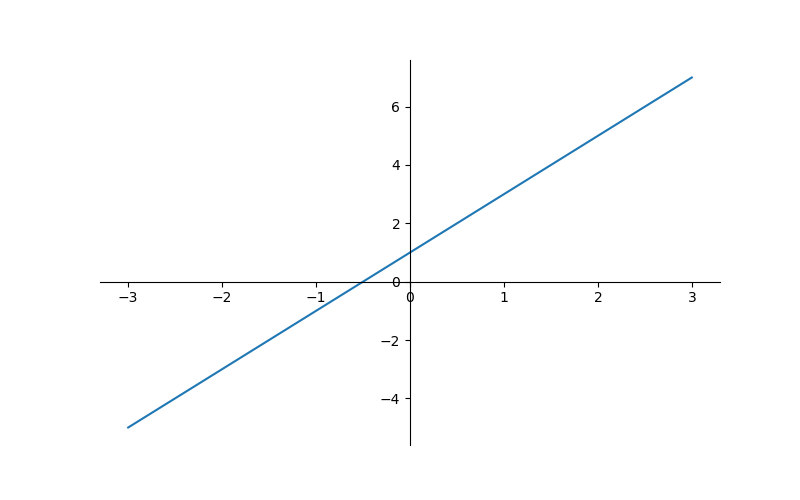
2、移动坐标
然后我们挪动坐标轴的位置.
>>> ax = plt.gca()
>>> ax.spines['right'].set_color('none')
>>> ax.spines['top'].set_color('none')
>>> ax.spines['top'].set_color('none')
>>> ax.xaxis.set_ticks_position('bottom')
>>> ax.spines['bottom'].set_position(('data', 0))
>>> ax.yaxis.set_ticks_position('left')
>>> ax.spines['left'].set_position(('data', 0))
>>> plt.show()
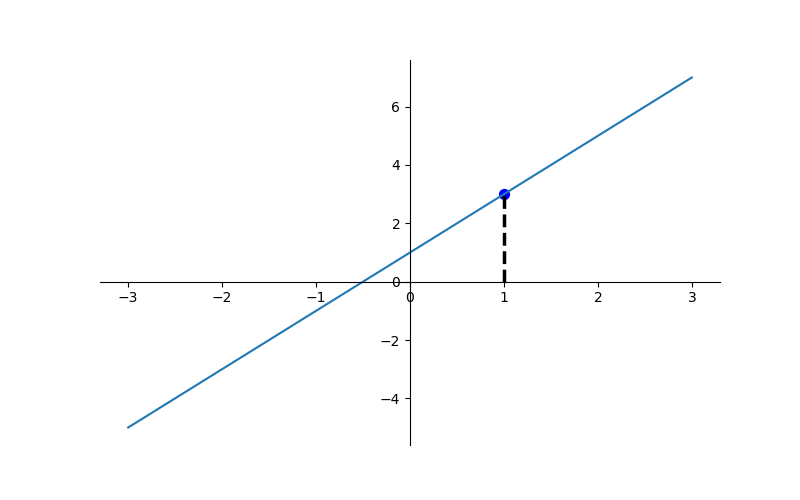
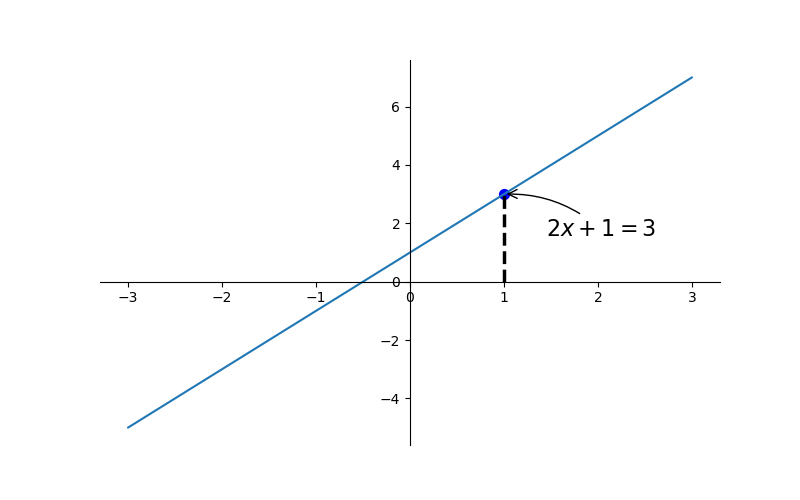
然后标注出点(x0, y0)的位置信息. 用plt.plot([x0, x0,], [0, y0,], 'k--', linewidth=2.5) 画出一条垂直于x轴的虚线.
>>> x0 = 1
>>> y0 = 2*x0 + 1
>>> plt.plot([x0, x0,], [0, y0,], 'k--', linewidth=2.5)
[<matplotlib.lines.Line2D object at 0x000001C38E026748>]
>>> # set dot styles
... plt.scatter([x0, ], [y0, ], s=50, color='b')
<matplotlib.collections.PathCollection object at 0x000001C38E018320>
>>> plt.show()
3、添加注释 annotate
接下来我们就对(x0, y0)这个点进行标注.
plt.annotate(r'$2x+1=%s$' % y0, xy=(x0, y0), xycoords='data', xytext=(+30, -30),
             textcoords='offset points', fontsize=16,
             arrowprops=dict(arrowstyle='->', connectionstyle="arc3,rad=.2"))

plt.show()
其中参数xycoords='data' 是说基于数据的值来选位置, xytext=(+30, -30) 和 textcoords='offset points' 对于标注位置的描述 和 xy 偏差值, arrowprops是对图中箭头类型的一些设置.
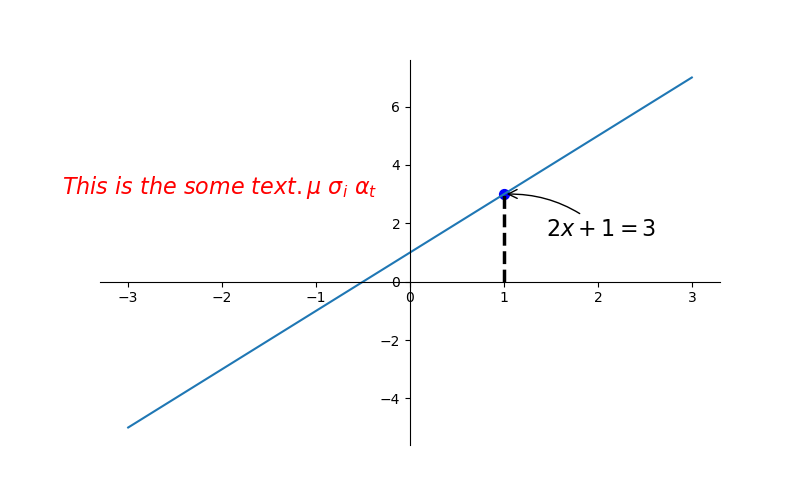
4、添加注释text
plt.text(-3.7, 3, r'$This\ is\ the\ some\ text. \mu\ \sigma_i\ \alpha_t$',
         fontdict={'size': 16, 'color': 'r'})
其中-3.7, 3,是选取text的位置, 空格需要用到转字符\ ,fontdict设置文本字体.