目录
MATLAB的4种二维图
1.线图
plot函数用来创建x和y值的简单线图
x = 0:0.05:30;   %从0到30,每隔0.05取一次值
y = sin(x);
plot(x,y) %若(x,y,'LineWidth',2) 可变粗
xlabel("横轴标题")
ylabel("纵轴标题")
grid on      %显示范围
axis([0 20 -1.5 1.5]) % 设置横纵坐标范 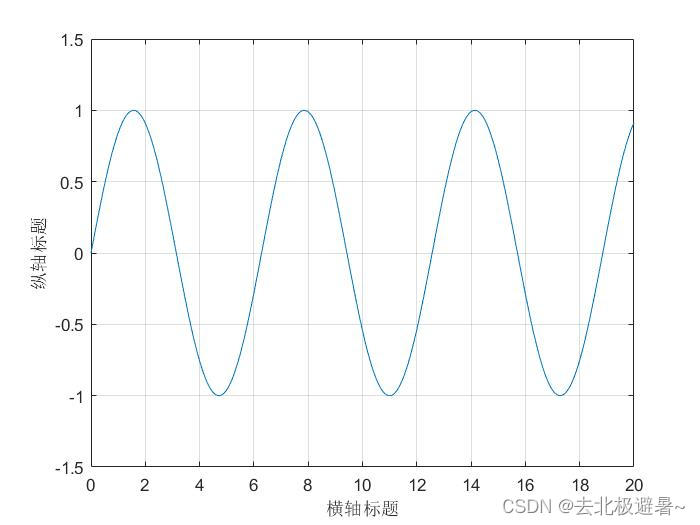
多组函数显示在同一张图
y1 = sin(x);
y2 = cos(x);
plot(x,y1,x,y2)
axis([0 20 -1.5 1.5])

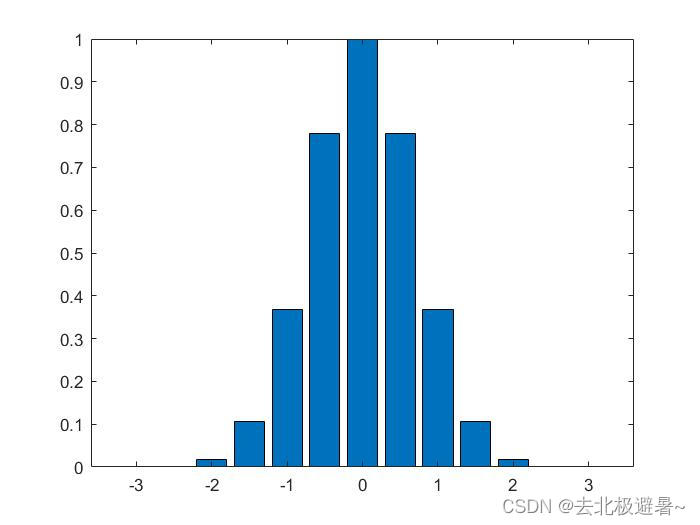
2.条形图
bar函数 函数创建【垂直】条形图
barh 函数用来创建【水平】条形图

3.极坐标图
polarplot 函数用来绘制极坐标图
theta = 0:0.01:2*pi;
%abs就绝对值或复数的模
radi = abs(sin(7*theta).*cos(10*theta));
polarplot(theta,radi)  %括号内是弧度和半径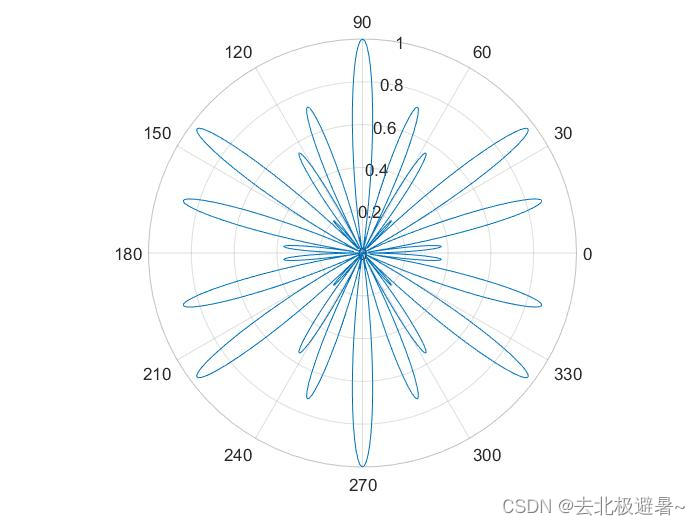
4.散点图
scatter函数用来绘制x和y值的散点图
Height = randn(1000,1);
Weight = randn(1000,1);
scatter(Height,Weight)
xlabel("Height")
ylabel("weight")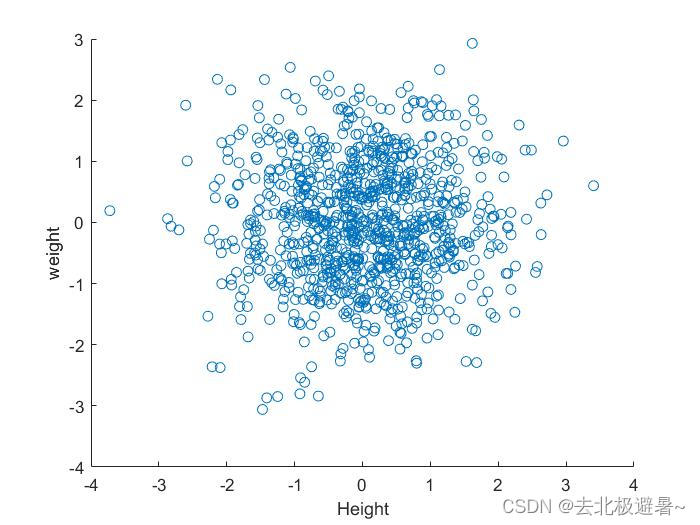
三维图和子图
1.三维曲面图
surf函数可用来做三维曲面图。一般是展示函数z = z(x,y)的图像。
首先需要用 meshgrid 创建好空间上(x,y)点。
[X,Y] = meshgrid(-2:0.2:2);
Z = X.*exp(-X.^2-Y.^2);
surf(X,Y,Z);
colormap hsv  %colormap设置颜色
colorbar  %设置颜色栏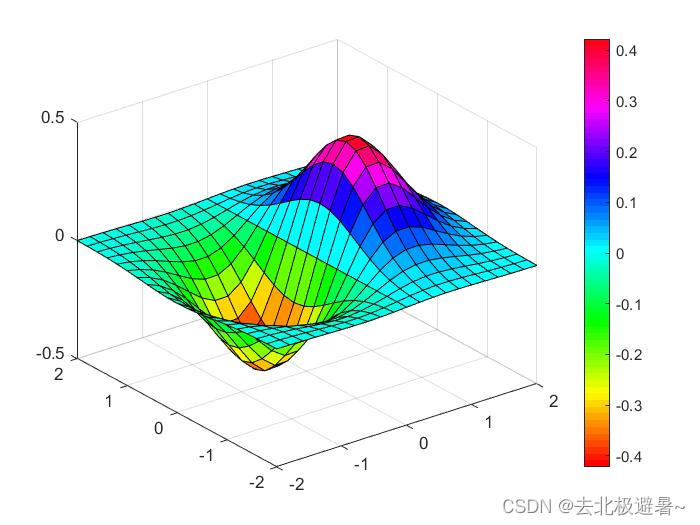
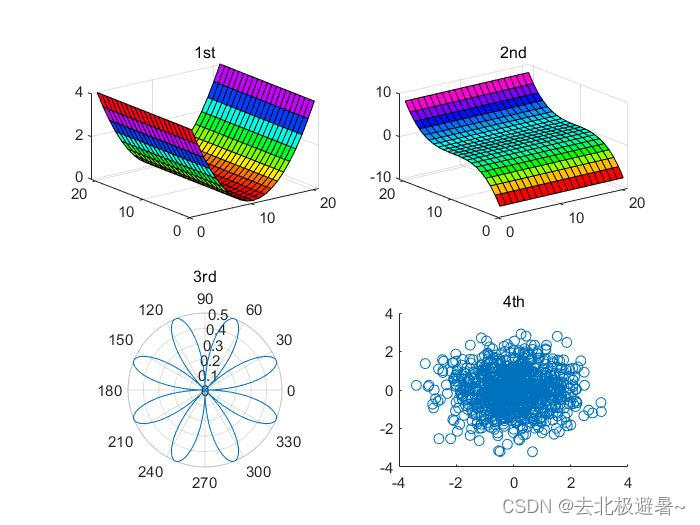
2.子图
使用 subplot 函数可以在同一窗口的不同子区域显示多个绘图
[X,Y] = meshgrid(-2:0.2:2);
theta = 0:0.01:2*pi;
radi = abs(sin(2*theta).*cos(2*theta));
Height = randn(1000,1);
Weight = randn(1000,1);

subplot(2,2,1);surf(X.^2);title('1st');
subplot(2,2,2);surf(Y.^3);title('2nd');
subplot(2,2,3);polarplot(theta,radi);title('3rd');
subplot(2,2,4);scatter(Height,Weight);title('4th');
%subplot(几行,几列,位置几)