首先查看数据
#coding:utf-8
"""
Created on Wen Jan 9 2019

@author: fzh
"""
import warnings
warnings.filterwarnings("ignore")
import matplotlib.pyplot as plt
plt.rcParams.update({'figure.max_open_warning': 0})
import seaborn as sns
from sklearn.model_selection import train_test_split
import pandas as pd
import numpy as np
from sklearn.model_selection import train_test_split
from sklearn.model_selection import GridSearchCV, RepeatedKFold, cross_val_score,cross_val_predict,KFold
from sklearn.metrics import make_scorer,mean_squared_error
from sklearn.linear_model import LinearRegression, Lasso, Ridge, ElasticNet
from sklearn.svm import LinearSVR, SVR
from sklearn.neighbors import KNeighborsRegressor
from sklearn.ensemble import RandomForestRegressor, GradientBoostingRegressor,AdaBoostRegressor
from xgboost import XGBRegressor
from sklearn.preprocessing import PolynomialFeatures,MinMaxScaler,StandardScaler
from sklearn.metrics import make_scorer
from scipy import stats
import os

#load_dataset
with open("data/zhengqi_train.txt")  as fr:
    data_train=pd.read_table(fr,sep="\t")
    print('data_train.shape=',data_train.shape)

with open("data/zhengqi_test.txt") as fr_test:
    data_test=pd.read_table(fr_test,sep="\t")
    print('data_test.shape=',data_test.shape)
#merge train_set and test_set  add origin
data_train["oringin"]="train"
data_test["oringin"]="test"
data_all=pd.concat([data_train,data_test],axis=0,ignore_index=True)
#View data
print('data_all.shape=',data_all.shape)
# Explore feature distibution
fig = plt.figure(figsize=(6, 6))
for column in data_all.columns[0:-2]:
    g = sns.kdeplot(data_all[column][(data_all["oringin"] == "train")], color="Red", shade = True)
    g = sns.kdeplot(data_all[column][(data_all["oringin"] == "test")], color="Blue", shade= True)
    g.set(xlabel=column,ylabel='Frequency')
    g = g.legend(["train","test"])
    plt.show()
可看出,train有2888行数据,test有1925行数据,然后查看train和test的每列数据的分布,横坐标是特征名,从v0到37,下面选择了v4和v5,可看出v4的train和test分布接近,而v5相差较大,类似较大的还有"V9","V11","V17","V22","V28",故可以删掉这些列特征。
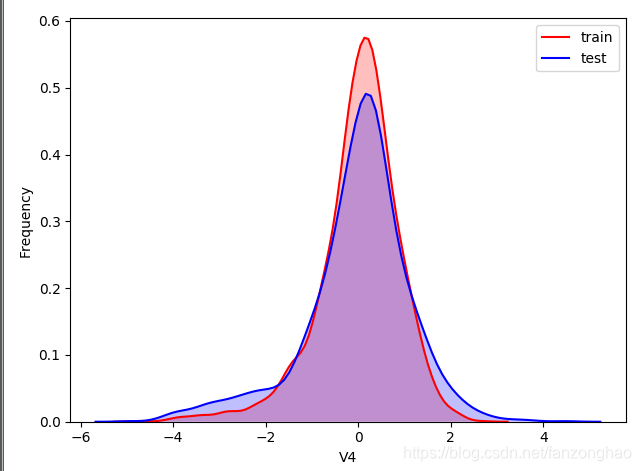
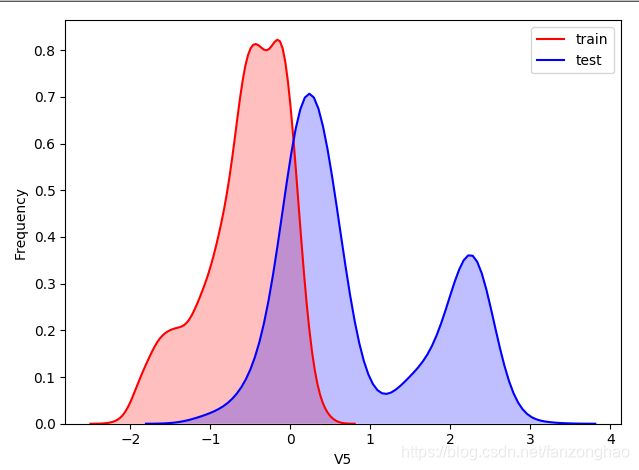
fig = plt.figure(figsize=(10, 10))
for i in range(len(data_all.columns)-2):
    #初始网格
    g = sns.FacetGrid(data_all, col='oringin')
    #利用map方法可视化直方图
    g = g.map(sns.distplot, data_all.columns[i])
    plt.savefig('distplot'+str(i)+'.jpg')
这里选取了v5
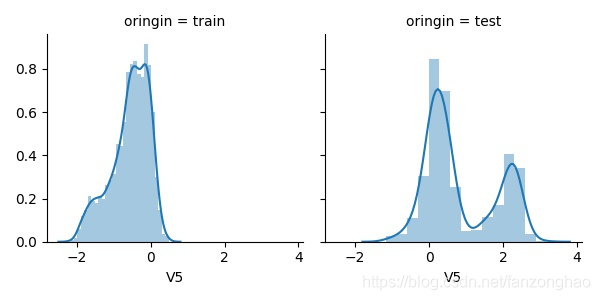
删掉"V5","V9","V11","V17","V22","V28"这些列特征。
"""删除特征"V5","V9","V11","V17","V22","V28",训练集和测试集分布不一致"""
data_all.drop(["V5","V9","V11","V17","V22","V28"],axis=1,inplace=True)
print('drop after data_all.shape=',data_all.shape)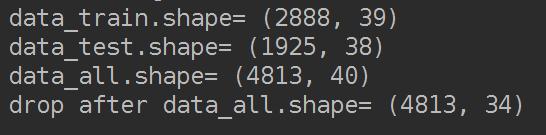
"""删除特征"V5","V9","V11","V17","V22","V28",训练集和测试集分布不一致"""
data_all.drop(["V5","V9","V11","V17","V22","V28"],axis=1,inplace=True)
print('drop after data_all.shape=',data_all.shape)

# figure parameters
data_train= data_all[data_all["oringin"] == "train"].drop("oringin", axis=1)
print('drop after data_train.shape=',data_train.shape)

"""找出相关程度"""
plt.figure(figsize=(20, 16))  # 指定绘图对象宽度和高度
colnm = data_train.columns.tolist()  # 列表头
mcorr = data_train.corr(method="spearman")  # 相关系数矩阵,即给出了任意两个变量之间的相关系数
print('mcorr.shape=',mcorr.shape)
mask = np.zeros_like(mcorr, dtype=np.bool)  # 构造与mcorr同维数矩阵 为bool型
#画上三角相关系数矩阵
mask[np.triu_indices_from(mask)] = True  # 上三角为1
g = sns.heatmap(mcorr, mask=mask, cmap=plt.cm.jet, square=True, annot=True, fmt='0.2f')  # 热力图(看两两相似度)
plt.savefig('mcorr.jpg')![]()
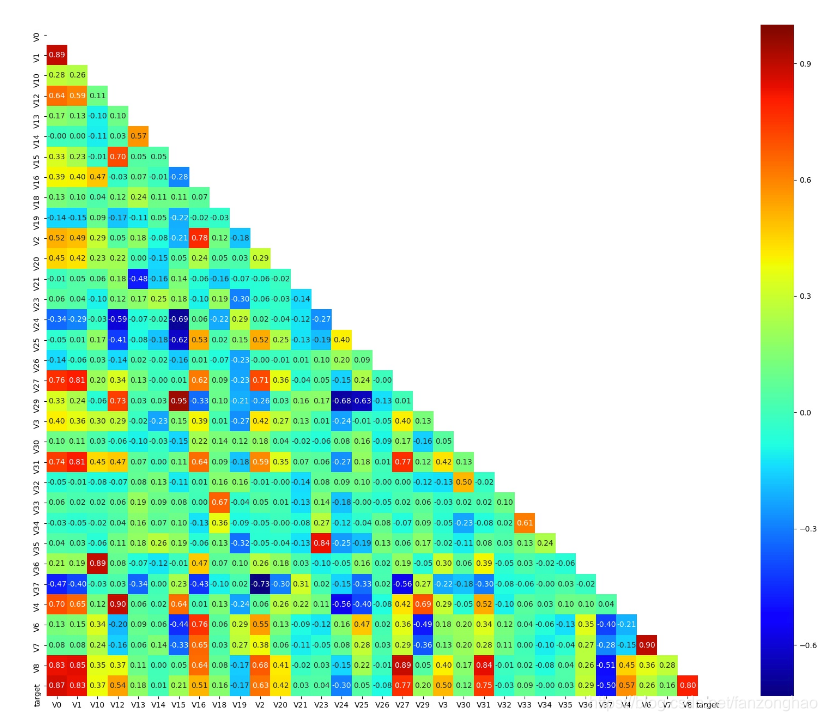
丢掉与target相关系数小于0.1的特征
# Threshold for removing correlated variables
threshold = 0.1
# Absolute value correlation matrix
corr_matrix = data_train.corr().abs()
drop_col=corr_matrix[corr_matrix["target"]<threshold].index
print('drop_col=',drop_col)
data_all.drop(drop_col,axis=1,inplace=True)
print('data_all.shape=',data_all.shape)![]()
对每一列特征进行最小最大归一化
"""归一化"""
cols_numeric=list(data_all.columns)
cols_numeric.remove("oringin")
def scale_minmax(col):
    return (col-col.min())/(col.max()-col.min())
scale_cols = [col for col in cols_numeric if col!='target']
print('scale_cols=',scale_cols)
data_all[scale_cols] = data_all[scale_cols].apply(scale_minmax,axis=0)
print('data_all[scale_cols].shape=',data_all[scale_cols].shape)
划分train,valid,和test
"""function to get training samples"""
def get_training_data():
    df_train = data_all[data_all["oringin"]=="train"]
    print('df_train.shape=',df_train.shape)
    y = df_train.target
    X = df_train.drop(["oringin","target"],axis=1)
    X_train,X_valid,y_train,y_valid=train_test_split(X,y,test_size=0.3,random_state=100)
    return X_train,X_valid,y_train,y_valid

"""extract test data (without SalePrice)"""
def get_test_data():
    df_test = data_all[data_all["oringin"]=="test"].reset_index(drop=True)
    return df_test.drop(["oringin","target"],axis=1)

"""metric for evaluation"""
def rmse(y_true, y_pred):
    diff = y_pred - y_true
    sum_sq = sum(diff ** 2)
    n = len(y_pred)
    return np.sqrt(sum_sq / n)

def mse(y_ture, y_pred):
    return mean_squared_error(y_ture, y_pred)
利用Ridge回归去掉边界点,边界点满足误差的正态分布方差大于3
"""function to detect outliers based on the predictions of a model"""
def find_outliers(model, X, y, sigma=3):
# predict y values using model
try:
y_pred = pd.Series(model.predict(X), index=y.index)
# if predicting fails, try fitting the model first
except:
model.fit(X, y)
y_pred = pd.Series(model.predict(X), index=y.index)
# calculate residuals between the model prediction and true y values
resid = y - y_pred
mean_resid = resid.mean()
std_resid = resid.std()
# calculate z statistic, define outliers to be where |z|>sigma
z = (resid - mean_resid) / std_resid
#找出方差大于3的数据的索引,然后丢掉
outliers = z[abs(z) > sigma].index
# print and plot the results
print('score=', model.score(X, y))
print('rmse=', rmse(y, y_pred))
print("mse=", mean_squared_error(y, y_pred))
print('---------------------------------------')
print('mean of residuals:', mean_resid)
print('std of residuals:', std_resid)
print('---------------------------------------')
print(len(outliers), 'outliers:')
print(outliers.tolist())
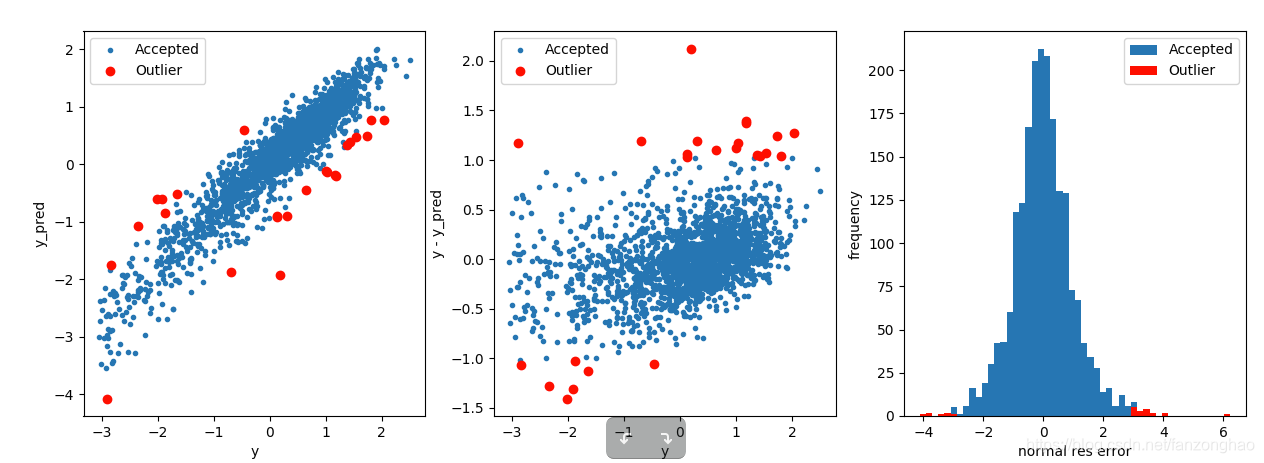
plt.figure(figsize=(15, 5))
plt.subplot(1, 3, 1)
plt.plot(y, y_pred, '.')
plt.plot(y.loc[outliers], y_pred.loc[outliers], 'ro')
plt.legend(['Accepted', 'Outlier'])
plt.xlabel('y')
plt.ylabel('y_pred')
plt.subplot(1, 3, 2)
plt.plot(y, y - y_pred, '.')
plt.plot(y.loc[outliers], y.loc[outliers] - y_pred.loc[outliers], 'ro')
plt.legend(['Accepted', 'Outlier'])
plt.xlabel('y')
plt.ylabel('y - y_pred')
plt.subplot(1, 3, 3)
plt.hist(z,bins=50)
plt.hist(z.loc[outliers],color='r', bins=50)
plt.legend(['Accepted', 'Outlier'])
plt.xlabel('normal res error')
plt.ylabel('frequency')
plt.savefig('outliers.png')
return outliers
# get training data
from sklearn.linear_model import Ridge
X_train, X_valid,y_train,y_valid = get_training_data()
# find and remove outliers using a Ridge model
outliers = find_outliers(Ridge(), X_train, y_train)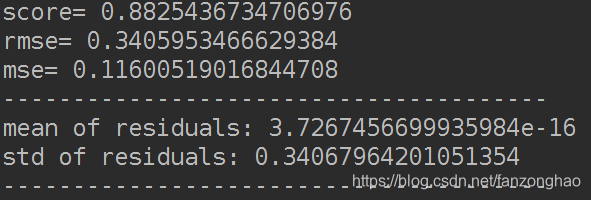
将移除的点进行训练
""" permanently remove these outliers from the data"""
X_t=X_train.drop(outliers)
y_t=y_train.drop(outliers)
#
def get_trainning_data_omitoutliers():
    y1=y_t.copy()
    X1=X_t.copy()
    return X1,y1

from sklearn.preprocessing import StandardScaler

def train_model(model, param_grid,splits=5, repeats=5):
    X, y = get_trainning_data_omitoutliers()
    poly_trans=PolynomialFeatures(degree=2)
    X=poly_trans.fit_transform(X)
    X=MinMaxScaler().fit_transform(X)
    # create cross-validation method
    rkfold = RepeatedKFold(n_splits=splits, n_repeats=repeats)

    # perform a grid search if param_grid given
    if len(param_grid) > 0:
        # setup grid search parameters
        gsearch = GridSearchCV(model, param_grid, cv=rkfold,
                               scoring="neg_mean_squared_error",
                               verbose=1, return_train_score=True)

        # search the grid
        gsearch.fit(X, y)

        # extract best model from the grid
        model = gsearch.best_estimator_
        best_idx = gsearch.best_index_

        # get cv-scores for best model
        grid_results = pd.DataFrame(gsearch.cv_results_)
        cv_mean = abs(grid_results.loc[best_idx, 'mean_test_score'])
        cv_std = grid_results.loc[best_idx, 'std_test_score']

    # no grid search, just cross-val score for given model
    else:
        grid_results = []
        cv_results = cross_val_score(model, X, y, scoring="neg_mean_squared_error", cv=rkfold)
        cv_mean = abs(np.mean(cv_results))
        cv_std = np.std(cv_results)

    # combine mean and std cv-score in to a pandas series
    cv_score = pd.Series({'mean': cv_mean, 'std': cv_std})

    # predict y using the fitted model
    y_pred = model.predict(X)

    # print stats on model performance
    print('----------------------')
    print(model)
    print('----------------------')
    print('score=', model.score(X, y))
    print('rmse=', rmse(y, y_pred))
    print('mse=', mse(y, y_pred))
    print('cross_val: mean=', cv_mean, ', std=', cv_std)

    return model, cv_score, grid_results
#
# places to store optimal models and scores
opt_models = dict()
score_models = pd.DataFrame(columns=['mean','std'])

# no. k-fold splits
splits=5
# no. k-fold iterations
repeats=5

print('=========Ridge model========================')
model = 'Ridge'
opt_models[model] = Ridge()
alph_range = np.arange(0.25,6,0.25)
param_grid = {'alpha': alph_range}
opt_models[model],cv_score,grid_results = train_model(opt_models[model], param_grid=param_grid,
                                              splits=splits, repeats=repeats)

cv_score.name = model
score_models = score_models.append(cv_score)

plt.figure()
plt.errorbar(alph_range, abs(grid_results['mean_test_score']),
             abs(grid_results['std_test_score'])/np.sqrt(splits*repeats))
plt.xlabel('alpha')
plt.ylabel('score')
plt.show()
#print('===========RandomForest model================')
#model = 'RandomForest'
#opt_models[model] = RandomForestRegressor()
#param_grid = {'n_estimators':[100,150,200],
              'max_features':[8,12,16,20,24],
              'min_samples_split':[2,4,6]}

#opt_models[model], cv_score, grid_results = train_model(opt_models[model], param_grid=param_grid,
                                              splits=5, repeats=1)
#cv_score.name = model
#score_models = score_models.append(cv_score)
#print('score_models=',score_models)
#import pickle
#with open("prediction.pkl", "wb") as f:
#    pickle.dump(opt_models[model], f)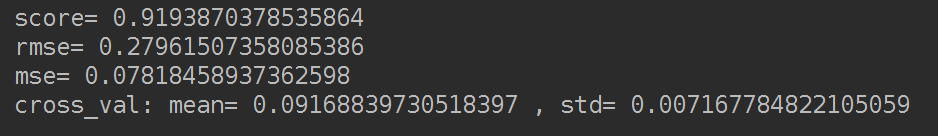
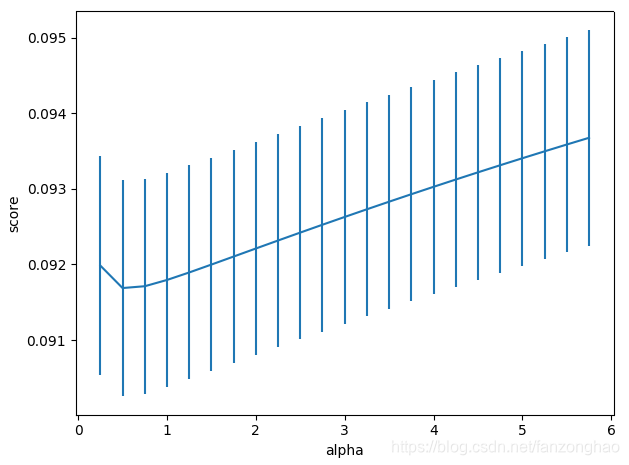
明显score高了。
后面用随机森林训练了一版并进行了保存。
完整train.py
#coding:utf-8
"""
Created on Wen Jan 9 2019

@author: fzh
"""
import warnings
warnings.filterwarnings("ignore")
import matplotlib.pyplot as plt
plt.rcParams.update({'figure.max_open_warning': 0})
import seaborn as sns
from sklearn.model_selection import train_test_split
import pandas as pd
import numpy as np
from sklearn.model_selection import train_test_split
from sklearn.model_selection import GridSearchCV, RepeatedKFold, cross_val_score,cross_val_predict,KFold
from sklearn.metrics import make_scorer,mean_squared_error
from sklearn.linear_model import LinearRegression, Lasso, Ridge, ElasticNet
from sklearn.svm import LinearSVR, SVR
from sklearn.neighbors import KNeighborsRegressor
from sklearn.ensemble import RandomForestRegressor, GradientBoostingRegressor,AdaBoostRegressor
# from xgboost import XGBRegressor
from sklearn.preprocessing import PolynomialFeatures,MinMaxScaler,StandardScaler
from sklearn.metrics import make_scorer
import os
from scipy import stats
from sklearn.preprocessing import StandardScaler
from beautifultable import BeautifulTable
import pickle
from sklearn.ensemble import ExtraTreesRegressor,AdaBoostRegressor
from sklearn.ensemble import  AdaBoostClassifier

def del_feature(data_train,data_test):
    data_train["oringin"]="train"
    data_test["oringin"]="test"
    data_all=pd.concat([data_train,data_test],axis=0,ignore_index=True)
    """删除特征"V5","V9","V11","V17","V22","V28",训练集和测试集分布不一致"""
    data_all.drop(["V5","V9","V11","V17","V22","V28"],axis=1,inplace=True)
    # print('drop after data_all.shape=',data_all.shape)
    # figure parameters
    data_train= data_all[data_all["oringin"] == "train"].drop("oringin", axis=1)
    # print('drop after data_train.shape=',data_train.shape)

    """'V14', u'V21', u'V25', u'V26', u'V32', u'V33', u'V34'"""
    # Threshold for removing correlated variables
    threshold = 0.1
    # Absolute value correlation matrix
    corr_matrix = data_train.corr().abs()
    drop_col=corr_matrix[corr_matrix["target"]<threshold].index
    # print('drop_col=',drop_col)
    data_all.drop(drop_col,axis=1,inplace=True)
    # print('data_all.shape=',data_all.shape)
    return data_all
"""function to get training samples"""
def get_training_data(data_all):
    df_train = data_all[data_all["oringin"]=="train"]
    y = df_train.target
    X = df_train.drop(["oringin","target"],axis=1)
    X_train,X_valid,y_train,y_valid=train_test_split(X,y,test_size=0.3,random_state=100)
    return X_train,X_valid,y_train,y_valid

"""extract test data (without SalePrice)"""
def get_test_data(data_all):
    df_test = data_all[data_all["oringin"]=="test"].reset_index(drop=True)
    return df_test.drop(["oringin","target"],axis=1)
#
"""metric for evaluation"""
def rmse(y_true, y_pred):
    diff = y_pred - y_true
    sum_sq = sum(diff ** 2)
    n = len(y_pred)
    return np.sqrt(sum_sq / n)

def mse(y_ture, y_pred):
    return mean_squared_error(y_ture, y_pred)

"""function to detect outliers based on the predictions of a model"""
def find_outliers(model, X, y, sigma=3):
    # predict y values using model
    try:
        y_pred = pd.Series(model.predict(X), index=y.index)
    # if predicting fails, try fitting the model first
    except:
        model.fit(X, y)
        y_pred = pd.Series(model.predict(X), index=y.index)

    # calculate residuals between the model prediction and true y values
    resid = y - y_pred
    mean_resid = resid.mean()
    std_resid = resid.std()

    # calculate z statistic, define outliers to be where |z|>sigma
    z = (resid - mean_resid) / std_resid
    #找出方差大于3的数据的索引,然后丢掉
    outliers = z[abs(z) > sigma].index

    # print and plot the results
    print('score=', model.score(X, y))
    print('rmse=', rmse(y, y_pred))
    print("mse=", mean_squared_error(y, y_pred))
    print('---------------------------------------')

    print('mean of residuals:', mean_resid)
    print('std of residuals:', std_resid)
    print('---------------------------------------')
    return outliers

def get_trainning_data_omitoutliers(X_t,y_t):
    y1=y_t.copy()
    X1=X_t.copy()
    return X1,y1

def scale_minmax(col):
    return (col - col.min()) / (col.max() - col.min())

def normal(data_all):
    """归一化"""
    cols_numeric = list(data_all.columns)
    cols_numeric.remove("oringin")
    scale_cols = [col for col in cols_numeric if col != 'target']
    print('scale_cols=', scale_cols)
    data_all[scale_cols] = data_all[scale_cols].apply(scale_minmax, axis=0)
    return data_all

if __name__ == '__main__':
    with open("data/zhengqi_train.txt")  as fr:
        data_train = pd.read_table(fr, sep="\t")

    with open("data/zhengqi_test.txt") as fr_test:
        data_test = pd.read_table(fr_test, sep="\t")

    data_all=del_feature(data_train,data_test)
    print('clear data_all.shape',data_all.shape)

    data_all=normal(data_all)
    X_train, X_valid, y_train, y_valid = get_training_data(data_all)
    print('X_train.shape=', X_train.shape)
    print('X_valid.shape=', X_valid.shape)


    X_test=get_test_data(data_all)
    print('X_test.shape',X_test.shape)

    # find and remove outliers using a Ridge model
    outliers = find_outliers(Ridge(), X_train, y_train)
    """ permanently remove these outliers from the data"""
    X_train,y_train=get_trainning_data_omitoutliers(X_train.drop(outliers),y_train.drop(outliers))

    X1=pd.concat([X_train,y_train],axis=1)
    X2=pd.concat([X_valid,y_valid],axis=1)
    X_all=pd.concat([X1,X2],axis=0)
    print(X_all)
    y = X_all['target']
    X = X_all.drop(["target"], axis=1)
    print(X.shape)
    X_train, X_valid, y_train, y_valid = train_test_split(X, y, test_size=0.3, random_state=100)

    poly_trans = PolynomialFeatures(degree=2)
    X_train = poly_trans.fit_transform(X_train)
    print(X_train.shape)

    X_valid = poly_trans.fit_transform(X_valid)
    print(X_valid.shape)
    print('==============forest_model========================')
    forest_model = RandomForestRegressor(
        n_estimators=500,
        criterion='mse',
        max_depth=20,
        min_samples_leaf=3,
        max_features=0.4,
        random_state=1,
        bootstrap=False,
        n_jobs=-1
    )
    forest_model.fit(X_train,y_train)
    importance =forest_model.feature_importances_
    table = BeautifulTable()
    # table.column_headers = ["feature", "importance"]
    print('RF feature importance:')
    # print(data_all)
    for i, cols in enumerate(X_all.iloc[:, :-1]):
        table.append_row([cols, round(importance[i], 3)])
    print(table)
    y_pred = forest_model.predict(X_valid)
    y_valid_rmse=rmse(y_valid,y_pred)
    print('y_valid_rmse=',y_valid_rmse)
    y_valid_mse = mse(y_valid, y_pred)
    print('y_valid_mse=',y_valid_mse)
    y_valid_score=forest_model.score(X_valid,y_valid)
    print('y_valid_score=',y_valid_score)

    with open("forest_model.pkl", "wb") as f:
        pickle.dump(forest_model, f)

    with open("forest_model.pkl", "rb") as f:
        model = pickle.load(f)
        y_pred = model.predict(X_valid)
        y_valid_rmse = rmse(y_valid, y_pred)
        print('y_valid_rmse=', y_valid_rmse)
        y_valid_mse = mse(y_valid, y_pred)
        print('y_valid_mse=', y_valid_mse)
        y_valid_score = model.score(X_valid, y_valid)
        print('y_valid_score=', y_valid_score)
inference.py 如下
#coding:utf-8
"""
Created on Wen Jan 9 2019

@author: fzh
"""
import pickle
import numpy as np
import os
import pandas as pd
from sklearn.preprocessing import PolynomialFeatures,MinMaxScaler
def del_feature(data_train,data_test):
    data_train["oringin"]="train"
    data_test["oringin"]="test"
    data_all=pd.concat([data_train,data_test],axis=0,ignore_index=True)
    """删除特征"V5","V9","V11","V17","V22","V28",训练集和测试集分布不一致"""
    data_all.drop(["V5","V9","V11","V17","V22","V28"],axis=1,inplace=True)
    # print('drop after data_all.shape=',data_all.shape)
    # figure parameters
    data_train= data_all[data_all["oringin"] == "train"].drop("oringin", axis=1)
    # print('drop after data_train.shape=',data_train.shape)

    """'V14', u'V21', u'V25', u'V26', u'V32', u'V33', u'V34'"""
    # Threshold for removing correlated variables
    threshold = 0.1
    # Absolute value correlation matrix
    corr_matrix = data_train.corr().abs()
    drop_col=corr_matrix[corr_matrix["target"]<threshold].index
    # print('drop_col=',drop_col)
    data_all.drop(drop_col,axis=1,inplace=True)
    # print('data_all.shape=',data_all.shape)
    return data_all
def scale_minmax(col):
    return (col - col.min()) / (col.max() - col.min())

def normal(data_all):
    """归一化"""
    cols_numeric = list(data_all.columns)
    cols_numeric.remove("oringin")
    scale_cols = [col for col in cols_numeric if col != 'target']
    print('scale_cols=', scale_cols)
    data_all[scale_cols] = data_all[scale_cols].apply(scale_minmax, axis=0)
    return data_all

"""extract test data (without SalePrice)"""
def get_test_data(data_all):
    df_test = data_all[data_all["oringin"]=="test"].reset_index(drop=True)
    return df_test.drop(["oringin","target"],axis=1)
if __name__ == '__main__':

    with open("data/zhengqi_train.txt")  as fr:
        data_train=pd.read_table(fr,sep="\t")

    with open("data/zhengqi_test.txt") as fr_test:
        data_test=pd.read_table(fr_test,sep="\t")
    data_all = del_feature(data_train, data_test)
    print('clear data_all.shape', data_all.shape)

    data_all=normal(data_all)

    X_test = get_test_data(data_all)
    print('X_test.shape', X_test.shape)
    poly_trans = PolynomialFeatures(degree=2)
    X_test = poly_trans.fit_transform(X_test)
    print(X_test.shape)

    with open("forest_model.pkl", "rb") as f:
        model = pickle.load(f)
        X_pre=model.predict(X_test)
        print(X_pre.shape)
        X_pre=list(map(lambda x:round(x,3),X_pre))
        X_pre=np.reshape(X_pre,(-1,1))
        print(X_pre.shape)
        X_pre=pd.DataFrame(X_pre)
        print(X_pre)
        X_pre.to_csv('result.txt',index=False,header=False)
得分0.1298,排名100多,第一次实践还算可以吧。