版权声明: https://blog.csdn.net/Blanchedingding/article/details/84109400
Isitio目前自带Prometheus和Grafana,但无法从外部访问,使用port forward只能从本地访问。运行下面的命令:
kubectl -n istio-system port-forward $(kubectl -n istio-system get pod -l app=prometheus -o jsonpath='{.items[0].metadata.name}') 9090:9090 &
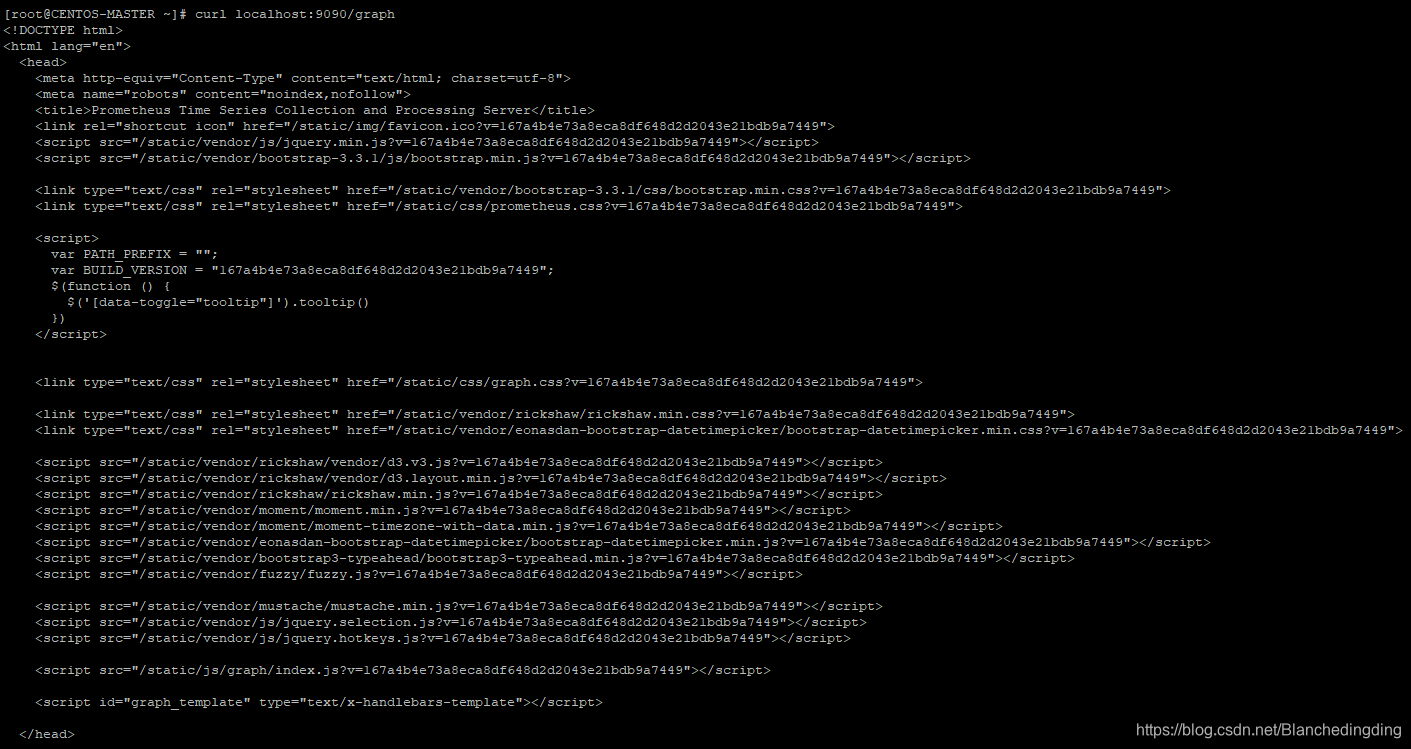
可以从本地curl到Prometheus的UI(curl localost:9090/graph):
想从外部浏览器访问到,需要将istio-demo.yaml文件中Prometheus和Grafana的Service改成NodePort类型,然后选择合适的nodePort:
# Source: istio/charts/prometheus/templates/service.yaml
apiVersion: v1
kind: Service
metadata:
  name: prometheus
  namespace: istio-system
  annotations:
    prometheus.io/scrape: 'true'
  labels:
    name: prometheus
spec:
  type: NodePort #原来是ClusterIP,改成NodePort
  selector:
    app: prometheus
  ports:
  - name: http-prometheus
    protocol: TCP
    port: 9090
    nodePort: 32339 #外部访问端口
---
# Source: istio/charts/grafana/templates/service.yaml
apiVersion: v1
kind: Service
metadata:
  name: grafana
  namespace: istio-system
  annotations:
    auth.istio.io/3000: NONE
  labels:
    app: grafana
    chart: grafana-0.1.0
    release: RELEASE-NAME
    heritage: Tiller
spec:
  type: NodePort #原来是没有type的,加上
  ports:
    - port: 3000
      targetPort: 3000
      protocol: TCP
      name: http
      nodePort: 32333 #加上外部访问端口
  selector:
    app: grafana
* nodePort要在30000到32767之间!!!!否则会报错:
The Service "grafana" is invalid: spec.ports[0].nodePort: Invalid value: 33333: provided port is not in the valid range. The range of valid ports is 30000-32767
重新部署istio-demo.yaml文件后、访问对应url,就会出现Prometheus(IP:32339/graph)和Grafana(IP:32333)的UI了。
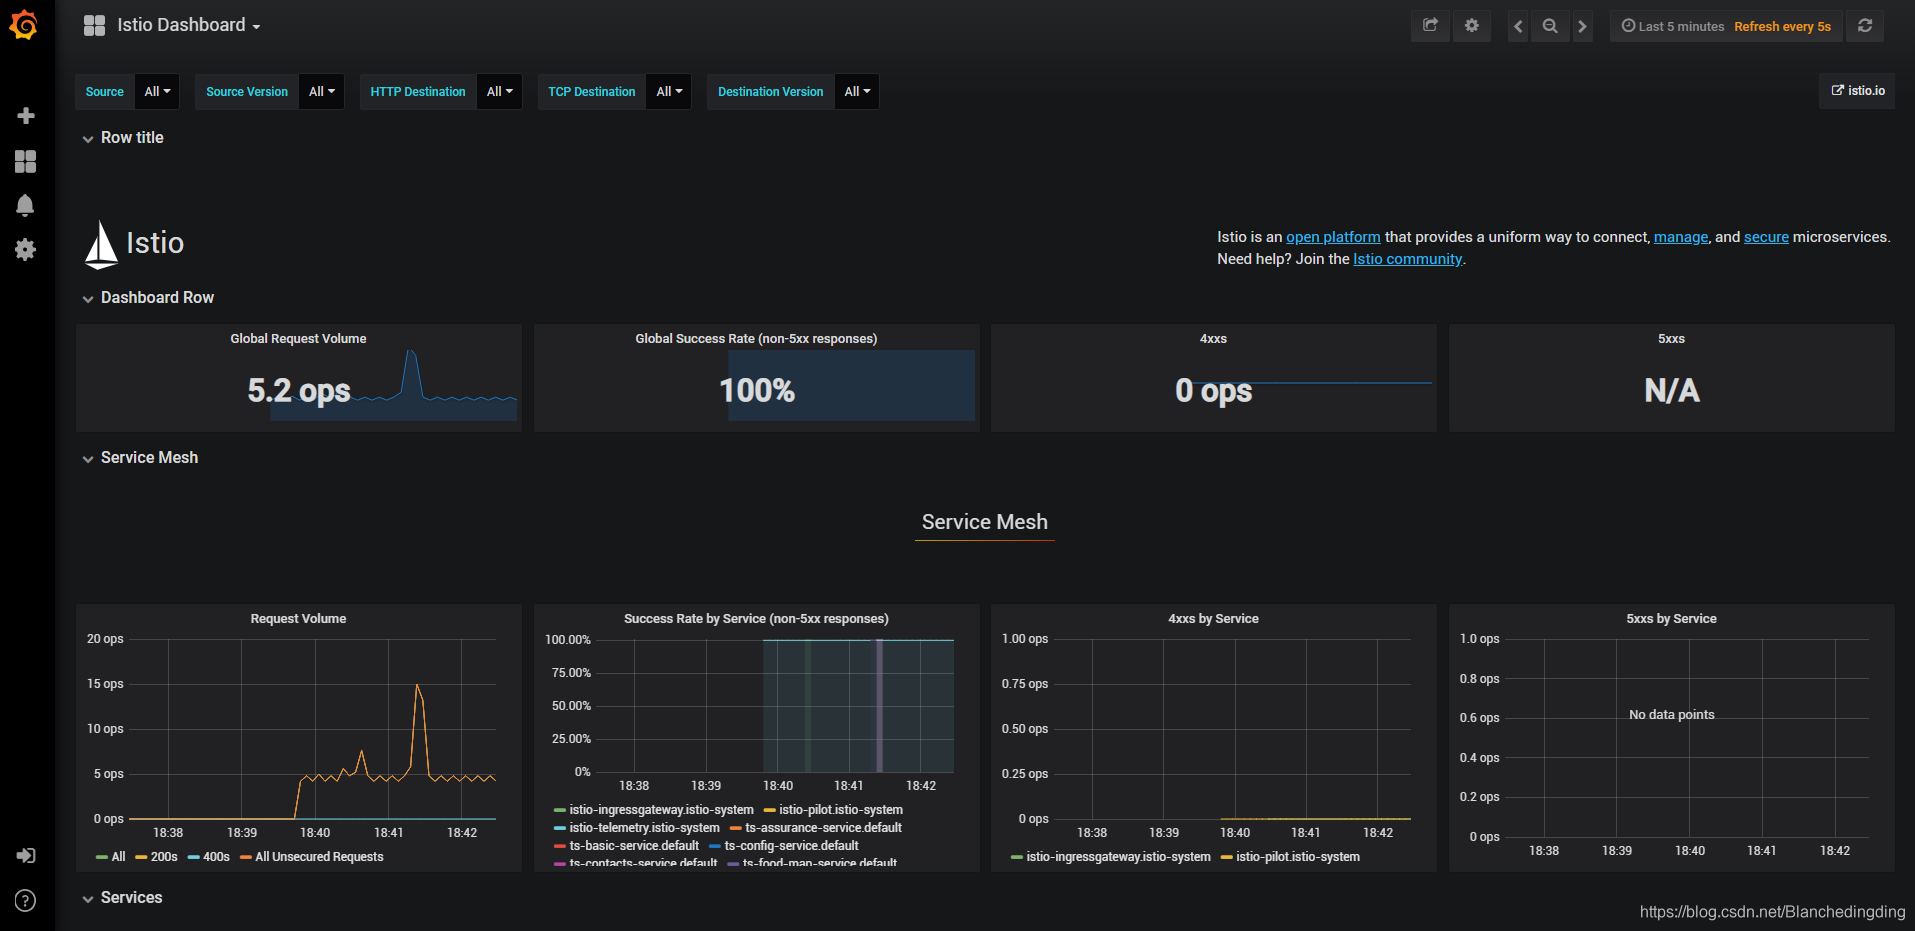
UI好看是好看,就是有点卡~~主要是性能指标的监控,从k8s的Mixer拿数据。