本文是利用热图(Heatmap)分析视频序列的标定。
注意,这里目的不是标定而是分析标定好的数据,或者也可以是检测的结果数据
文章结构是这样的,先详细的解释一下热图分析有什么用,根据一些具体的应用实例给出相应的教程和Python实现代码。
为什么要用热图对Logo检测结果进行分析
在计算机视觉中,经常会有将视频帧中的物体用四边形、多边形或者掩码(masks)标定出来的工作。标定的工作可以是人工手动的对一些训练数据,也可以是为了利用机器学习等方法对物体进行自动检查和跟踪得到的。
逐帧的分析上述得到的标定数据是不现实的,因为会有长视频的因素,有些几分钟有些几个小时,分析起来很费力。此外,虽然视频时长较短,但是视频个数很多,例如训练数据集。这时候使用热图分析会将分析任务变得很方便直观。
热图能有效的分析视频中物体的曝光位置和曝光量。视频帧中某些位置出现频率高(曝光量高),那么热图对应位置处是红色的(hot),相反的,视频帧中某些位置出现频率低(曝光量低),那么热图对应位置处是蓝色的(cool)。
使用热图分析各种logo的曝光量
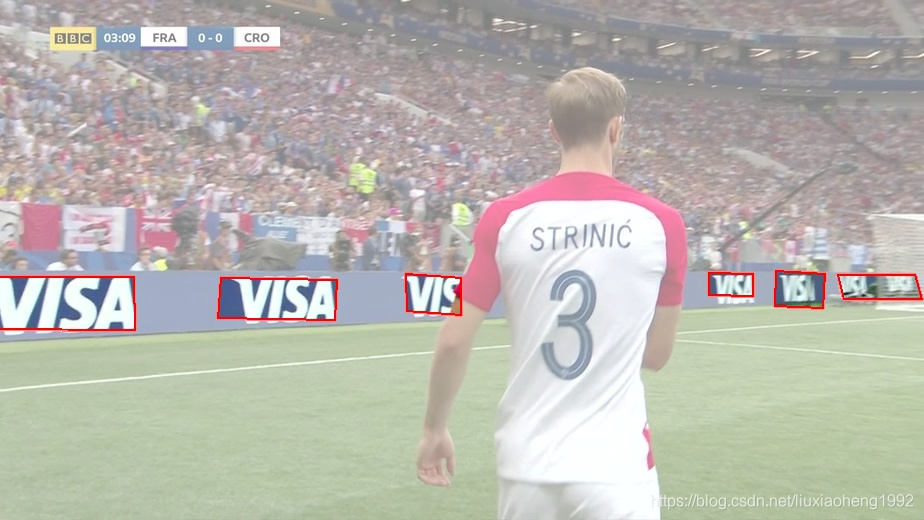
Orpix公司利用DL的方法将数字媒体中的商标、logos检测出来,然后对赞助商进行估价,下面是该公司logo检测的一个例图。
赞助商会在他们赞助的活动上将他们的logo投放到数字板和衣服上。市场调查人员基于多种因素评估品牌的曝光质量,考虑的因素有如下:
- 曝光时间,在屏幕上曝光时间越长,广告投放的就越成功
- 曝光位置,logo的曝光位置越靠近下面几个位置上认为曝光质量越高:
a. 视频帧的中间,因为视频帧的中间位置更能吸引观众的关注
b. 著名球星的衣服上 - logo大小和清晰度,在广告中,广告大小对曝光质量影响很大。毫无疑问,一个广告占满整个屏幕会比没有占满整个屏幕的广告更有影响力。相似的,清晰的广告会比模糊的广告更有影响力。
- 独占曝光位置,广告商在为自己产品或者商标打广告时不喜欢和其他的商标分享曝光时间。他们通常喜欢在独占一定时间内的所有广告位置,如上图所示。
利用热图分析视频中logo的曝光情况,能提升曝光质量评价的速度。
2018世界杯决赛中的logo分析
2018世界杯是全世界上亿人的狂欢时段。甚至在某些国家,世界杯期间不用上班,非常的high。
当人们聚集在电视前讨论着他们喜欢的足球队时,还有很多数据分析师正在做着数据的分析工作,目的是为了分析比赛期间所展示的赞助活动的有效性。
Orpix公司利用一些logo的检测算法对美国直播的视频进行logo的检测。世界杯决赛时长为2小时26分钟13秒。该公司按照每秒一帧对视频进行抽样,总共抽取了8773帧图像。
Nike Logo检测分析
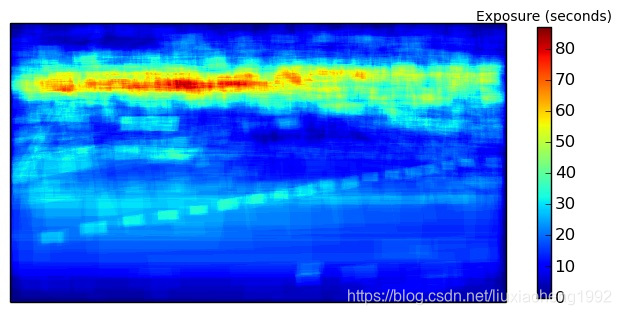
毋庸置疑,Nike(世界上最大的运动品牌公司)投放的logo,在运动员衣服上,出现了1221帧,以占比赛14%时长的成绩登顶为曝光最长的logo。下面是Nike的曝光热图。
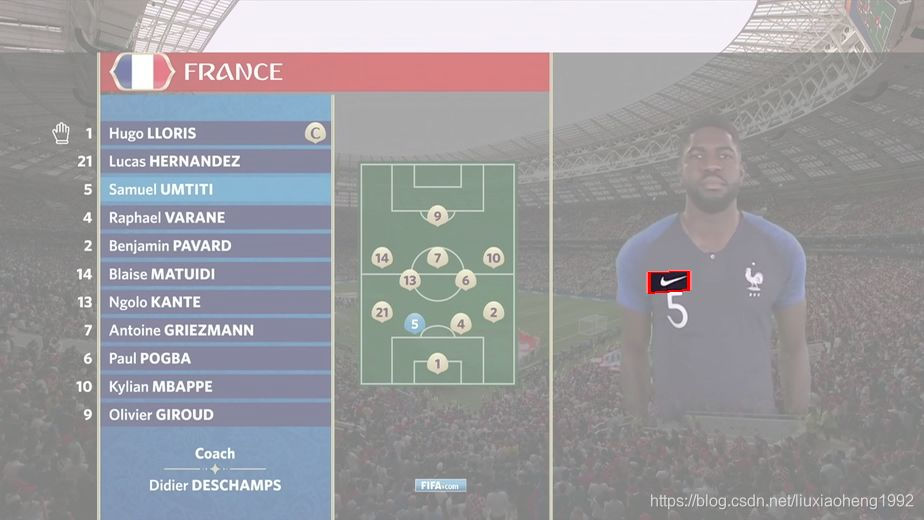
虽然Nike在整场比赛中曝光时间最长,但是热图显示,曝光在整个图像的分布非常均匀。这点也很容易的从最长36s曝光时间的图像和整个1221曝光帧中看出。从热图上吸引人的是一小块红色的点是怎么来的。通过观察这个位置的原图,可以知道,当介绍球员时,Nike也跟着产生曝光量,如下图所示。
VISA Logo检测分析
除了分析球员衣服上的logo外,还可以分析数字板上的logo。信用卡处理公司VISA在数字板上曝光时间最长(769s),运动品牌巨头Adidas紧随其后。
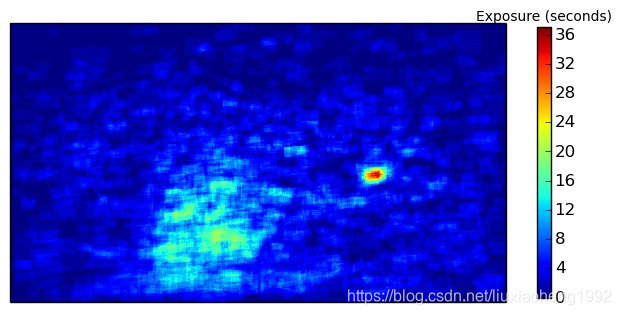
VISA logo的热图如下图所示。下面红色区域是80帧的结果,其位置分布在图片的左上角。不同于Nike的热图均匀分布在整张图片,它的热图主要集中在一个特定的区域。原因是logo是在数字板上显示的,而不是和Nike一样出现在不断移动的运动员身上。
这里,Orpix给出了世界杯决赛的所有分析样例
Logo 热图生成的代码
下面是根据Orpix给出的VISA logo检测数据进行分析生成热图的代码。
在学习代码前需要的环境是
- opencv-python
- matplotlib
- numpy
Code Overview
- generate_heatmap.py 生成热图代码文件
- 世界杯决赛Visa标定数据
下载好上面的数据,将数据加压后与代码文件放在同一个文件夹下即可运行。
输入
labels.txt - 里面包含了对应图片的VISA logo标定信息,文件里每行数据如下定义:
图片路径 图片中logo数量 x1 y1 x2 y2 x3 y3 x4 y4 …
注意:这里定义的框不是矩形所以不能使用x,y,width,height表示而是采用四个点的坐标表示
输出
高亮的帧 - 输出对应于每张输入的logo区域高亮(其实将非logo区域加一个蒙层,为了大家容易理解,也为了方便调试)图片
热图 - 输出一张名为"heatmap.png"的热图,热图的生成用的是matplotlib包里的函数
代码细节
首先,初始化一个空的numpy array数组,用来存储生成heatmap的数据。
#keeps track of exposure time per pixel.  Accumulates for each image
#gets initialized when we process the first image
accumulated_exposures = None
#frames were sampled at one second per frame.  If you sampled frames from a
#video at a different rate, change this value.
#
#if you sampled frames at 10 frames per second, this value would be 0.1
#
seconds_per_frame = 1.0
然后读取labels.txt获取每张图片的logo位置,为每张图片生成一个mask,mask中logo区域值为seconds_per_frame,非logo区域值为0。最后将所有的mask相加就可以得到产生热图的数据了。
#parse the line using helper function
frame_path, labels = parse_line(line)

print "processing %s" % frame_path

#load the image
frame = cv2.imread(frame_path)

#this is where the highlighted images will go
if not os.path.exists('output'):
    os.mkdir('output')

#if the heatmap is None we create it with same size as frame, single channel
if type(accumulated_exposures) == type(None):
    accumulated_exposures = np.zeros((frame.shape[0], frame.shape[1]), dtype=np.float)

#we create a mask where all pixels inside each label are set to number
#of seconds per frame that the video was sampled at.
#So as we accumulate the exposure heatmap counts, each pixel contained
#inside a label contributes the seconds_per_frame to the overall
#accumulated exposure values
maskimg = np.zeros(accumulated_exposures.shape, dtype=np.float)
for label in labels:
    cv2.fillConvexPoly(maskimg, label, (seconds_per_frame))


#highlight the labels on the image and save.
#comment out the 2 lines below if you only want to compute the heatmap
highlighted_image = highlight_labels(frame, labels, maskimg)
cv2.imwrite('output/%s' % os.path.basename(frame_path), highlighted_image)

#accumulate the heatmap object exposure time
accumulated_exposures = accumulated_exposures + maskimg
最后,利用matplotlib画出热图
#
#create final heatmap using matplotlib
#
data = np.array(accumulated_exposures)
#create the figure
fig, axis = plt.subplots()
#set the colormap - there are many options for colormaps - see documentation
#we will use cm.jet
hm = axis.pcolor(data, cmap=plt.cm.jet)
#set axis ranges
axis.set(xlim=[0, data.shape[1]], ylim=[0, data.shape[0]], aspect = 1)
#need to invert coordinate for images
axis.invert_yaxis()
#remove the ticks
axis.set_xticks([])
axis.set_yticks([])

#fit the colorbar to the height
shrink_scale = 1.0
aspect = data.shape[0]/float(data.shape[1])
if aspect < 1.0:
    shrink_scale = aspect
clb = plt.colorbar(hm, shrink=shrink_scale)
#set title
clb.ax.set_title('Exposure (seconds)', fontsize = 10)
#saves image to same directory that the script is located in (our working directory)
plt.savefig('heatmap.png', bbox_inches='tight')
#close objects
plt.close('all')