学习最好的办法直接看开发文档
开发文档链接
https://matplotlib.org/api/_as_gen/matplotlib.pyplot.scatter.html?highlight=scatter#matplotlib.pyplot.scatter
matplotlib.pyplot.scatter
#绘制散点图的函数,x,y分别对应点的x轴坐标和y轴坐标
plt.scatter(x,y)
这是定义
matplotlib.pyplot.scatter(x, y, s=None, c=None, marker=None,
cmap=None, norm=None, vmin=None, vmax=None, alpha=None, linewidths=None,
verts=None, edgecolors=None, *, data=None, **kwargs)[source]
从x,y开始测试
x,y
x, y : array_like, shape (n, )
The data positions. 硕宁 x,y两个一维数组
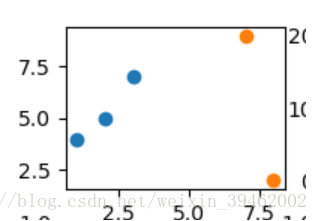
第一步 测试X,Y数据类型。在这里,用subplots建立9个图,代码为
a,b=plt.subplots(3,3) 调用b[0,0].scatter(x, y)
其它调用方法有 :
plt.subplot(3,3,1) #参数3行3列 9个子图第1个即(0,0)plt.subplot(338) #参数3行3列 9个子图第8个即(3,2)
说明,x,y数据可以是list,tuple,dict不行
a,b=plt.subplots(3,3)
x,y=np.array([[1,2,3],[4,5,7]])
b[0,0].scatter(x, y)
b[0,0].scatter((7,8),[9,2])
plt.show()
参数s:s : scalar or array_like, shape (n, ), optional
The marker size in points**2. Default is rcParams[‘lines.markersize’] ** 2.
s :标量或类数组,形状( n,),可选点* * 2中的标记大小。默认为rcParams [ ’ lines . markersize ’ ] * * 2。测试s结构,亮代码吧
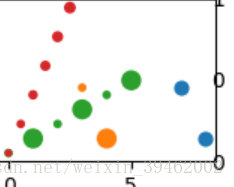
a,b=plt.subplots(3,3)
x,y=np.array([[1,2,3],[4,5,7]])
area=40 #固定值
b[0,1].scatter((7,8),[9,2],s=area)  #大小一样,40(蓝色的点)
area1=(10,75)
b[0,1].scatter((3,4),[9,2],s=area1)  #点(3,9)10,点(4,2)75  (橙色的点)
x=np.arange(6)
y=x*2
b[0,1].scatter(x,y,s=area1)
#显示6个点,大小(10,75,10,75,10,75)(绿色的点)
area2=range(7,100,3)
b[0,1].scatter(x/2,y*2,s=area2)
#显示6个点,大小(7,10,13,16,19,22) (红色的点)
plt.show()
这说明,每个点point[i]的大小等于s[i]大小,如果i>len(s),s索引取i对len(s)求余,我写了一个算法:可以测试一下:
def 测试变长输入(a:list,b:list) -> dict:
    c={}
    for i,j in enumerate(a):
        c[j]=b[i % len(b)]
    return c
print(测试变长输入([1,2],[3])) #out {1: 3, 2: 3} 说明 1,2作为Key,对应Value均为3
print(测试变长输入([1,2],[3,4,5])) #out {1: 3, 2: 3} {1: 3, 2: 4} 说明 1,2作为Key,对应Value均为3在这里插入代码片
接下来测试C
c : color, sequence, or sequence of color, optional, default: ‘b’
The marker color. Possible values:
A single color format string.
A sequence of color specifications of length n.
A sequence of n numbers to be mapped to colors using cmap and norm.
A 2-D array in which the rows are RGB or RGBA.
Note that c should not be a single numeric RGB or RGBA sequence because that is indistinguishable from an array of values to be colormapped. If you want to specify the same RGB or RGBA value for all points, use a 2-D array with a single row. Otherwise, value- matching will have precedence in case of a size matching with x and y.
c :颜色、顺序或颜色顺序,可选,默认为:“b”
标记颜色。可能的值:
单色格式字符串。
长度为n的颜色规格序列
要使用cmap和norm映射到颜色的n个数字的序列。
一种二维数组,其中的行是RGB或RGBA。请注意,c不应是单个数字RGB或RGBA序列,因为这与要彩色映射的值数组无法区分。如果要为所有点指定相同的RGB或RGBA值,请使用带有单行的二维数组。否则,如果大小与x和y匹配,则值匹配优先。 也就是c说支持字符和数字定义
c颜色[‘blue’, ‘green’, ‘red’, ‘cyan’, ‘magenta’, ‘yellow’, ‘black’, ‘white’]
对应[‘c’, ‘b’, ‘g’, ‘r’, ‘c’, ‘m’, ‘y’, ‘k’, ‘w’],实际上c和s的调用模式是一样的
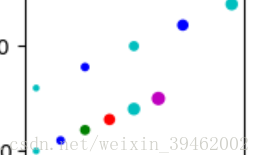
a,b=plt.subplots(3,3)
col=['c', 'b', 'g', 'r', 'c', 'm', 'y', 'k', 'w']
colq=['c', 'b']
b[0,2].scatter(range(6),range(6),s=range(5,50,5),c=col)
#显示6个点,颜色'c', 'b', 'g', 'r', 'c', 'm'
b[0,2].scatter(range(0,10,2),range(6,16,2),s=range(5,50,5),c=colq)
#显示5个点,颜色'c', 'b','c', 'b','c'
plt.show()
这一篇先 写到这,下一篇再研究其它参数