函数头:
def Axes.scatter(self, x, y, s=20, c='b', marker='o', cmap=None, norm=None, vmin=None, vmax=None, alpha=None, linewidths=None, verts=None, **kwargs)
返回:: PathCollection
要求:x,y必须是相同长度序列
----------
x,y:输入组,类似数组
Input data
实验:画三个点
fig1 = plt.figure(num='fig1',figsize=(6,3),dpi=75,facecolor='#FFFFFF',edgecolor='#FF0000')
plt.xlim(0,20)
plt.ylim(0,10)

x = [2,4,6]
y = [2,2,2]
plt.scatter(x,y)

plt.show()
plt.close()
s:点的大小(面积),标量或数组,缺省值为 (20*20)
size in points^2.
实验:
x = [2,4,6,8,10,14,18]
y = [2,2,2,2,2,2,2]
s = []
for i in x:
  s.append(i*i)
plt.scatter(x,y,s=s)
运行结果 :
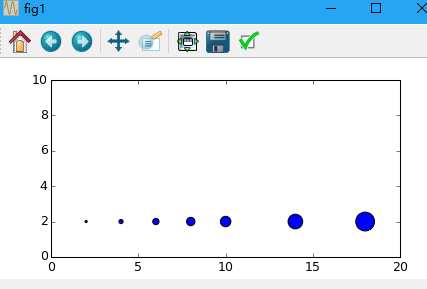
注意:s实际显示的最小尺寸受到linewidth的影响
c:颜色
`c` can be a single color format string, or a sequence of color
specifications of length `N`, or a sequence of `N` numbers to be
mapped to colors using the `cmap` and `norm` specified via kwargs
(see below). Note that `c` should not be a single numeric RGB or
RGBA sequence because that is indistinguishable from an array of
values to be colormapped. `c` can be a 2-D array in which the
rows are RGB or RGBA, however.
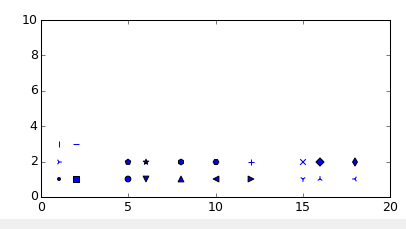
marker:点的形状
See `~matplotlib.markers` for more information on the different
styles of markers scatter supports.
实验:
#'.' point marker
plt.scatter(1,1,s=30,marker='.')
#',' pixel marker
plt.scatter(2,1,s=30,marker=',')
#'o' circle marker
plt.scatter(5,1,s=30,marker='o')
#'v' triangle_down marker
plt.scatter(6,1,s=30,marker='v')
#'^' triangle_up marker
plt.scatter(8,1,s=30,marker='^')
#'<' triangle_left marker
plt.scatter(10,1,s=30,marker='<')
#'>' triangle_right marker
plt.scatter(12,1,s=30,marker='>')
#'1' tri_down marker
plt.scatter(15,1,s=30,marker='1')
#'2' tri_up marker
plt.scatter(16,1,s=30,marker='2')
#'3' tri_left marker
plt.scatter(18,1,s=30,marker='3')
#'4' tri_right marker
plt.scatter(1,2,s=30,marker='4')
#'s' square marker
#plt.scatter(2,2,s=30,marker='5')
#'p' pentagon marker
plt.scatter(5,2,s=30,marker='p')
#'*' star marker
plt.scatter(6,2,s=30,marker='*')
#'h' hexagon1 marker
plt.scatter(8,2,s=30,marker='h')
#'H' hexagon2 marker
plt.scatter(10,2,s=30,marker='H')
#'+' plus marker
plt.scatter(12,2,s=30,marker='+')
#'x' x marker
plt.scatter(15,2,s=30,marker='x')
#'D' diamond marker
plt.scatter(16,2,s=30,marker='D')
#'d' thin_diamond marker
plt.scatter(18,2,s=30,marker='d')
#'|' vline marker
plt.scatter(1,3,s=30,marker='|')
#'_' hline marker
plt.scatter(2,3,s=30,marker='_')
运行结果:
cmap:颜色调色板
A `~matplotlib.colors.Colormap` instance or registered name.
`cmap` is only used if `c` is an array of floats. If None,
defaults to rc `image.cmap`.
norm:颜色灰度,值在0,1之间
A `~matplotlib.colors.Normalize` instance is used to scale
luminance data to 0, 1. `norm` is only used if `c` is an array of
floats. If `None`, use the default :func:`normalize`.
vmi,vmax:标量,同norm结合使用,调节颜色的亮度
`vmin` and `vmax` are used in conjunction with `norm` to normalize
luminance data. If either are `None`, the min and max of the
color array is used. Note if you pass a `norm` instance, your
settings for `vmin` and `vmax` will be ignored.
alpha:透明度,值在0(透明)和1(不透明)之间
The alpha blending value, between 0 (transparent) and 1 (opaque)
linewidths:线宽
If None, defaults to (lines.linewidth,). Note that this is a
tuple, and if you set the linewidths argument you must set it as a
sequence of floats, as required by
`~matplotlib.collections.RegularPolyCollection`.
实验:
plt.scatter(1,2,s=50,linewidths=1.0,marker='o',c='w')
plt.scatter(4,2,s=50,linewidths=2.0,marker='o',c='w')
plt.scatter(8,2,s=50,linewidths=4.0,marker='o',c='w')
plt.scatter(12,2,s=50,linewidths=8.0,marker='o',c='w')
plt.scatter(16,2,s=50,linewidths=16.0,marker='o',c='w')
运行结果:
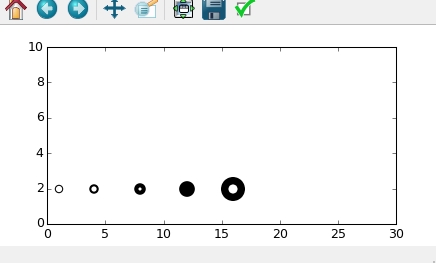
线宽越大,“o"点也越大
Returns
-------
paths : `~matplotlib.collections.PathCollection`
Other parameters
----------------
kwargs : `~matplotlib.collections.Collection` properties
------
'x','y','s','c'参数可以被 masked,只有unmasked的点才会被绘制
which case all masks will be combined and only unmasked points
will be plotted.
Examples
--------
.. plot:: mpl_examples/shapes_and_collections/scatter_demo.py
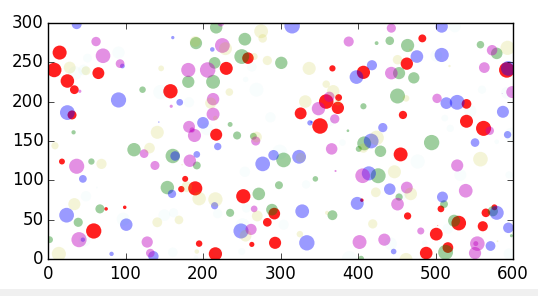
随机点图
# -*- coding:utf-8 -*-
import numpy as np
import matplotlib.pyplot as plt

fig1 = plt.figure(num='fig1',figsize=(6,3),dpi=100,facecolor='#FFFFFF',edgecolor='#FF0000')
plt.xlim(0,600)
plt.ylim(0,300)

N = input('Please input a number:')
c = ['r','g','b','m','y','c']
for cc in c:
    x =np.random.randint(0,600,N)
    y =np.random.randint(0,300,N)
    s =np.random.randint(1,500,N)
    a =np.random.rand()
    plt.scatter(x,y,s=s,linewidths=0,marker='.',c=cc,alpha=a)

plt.show()
plt.close()
运行结果: