版权声明:本文为博主原创文章,未经博主允许不得转载。 https://blog.csdn.net/qq_39591494/article/details/84838201
Python对excel进行分析
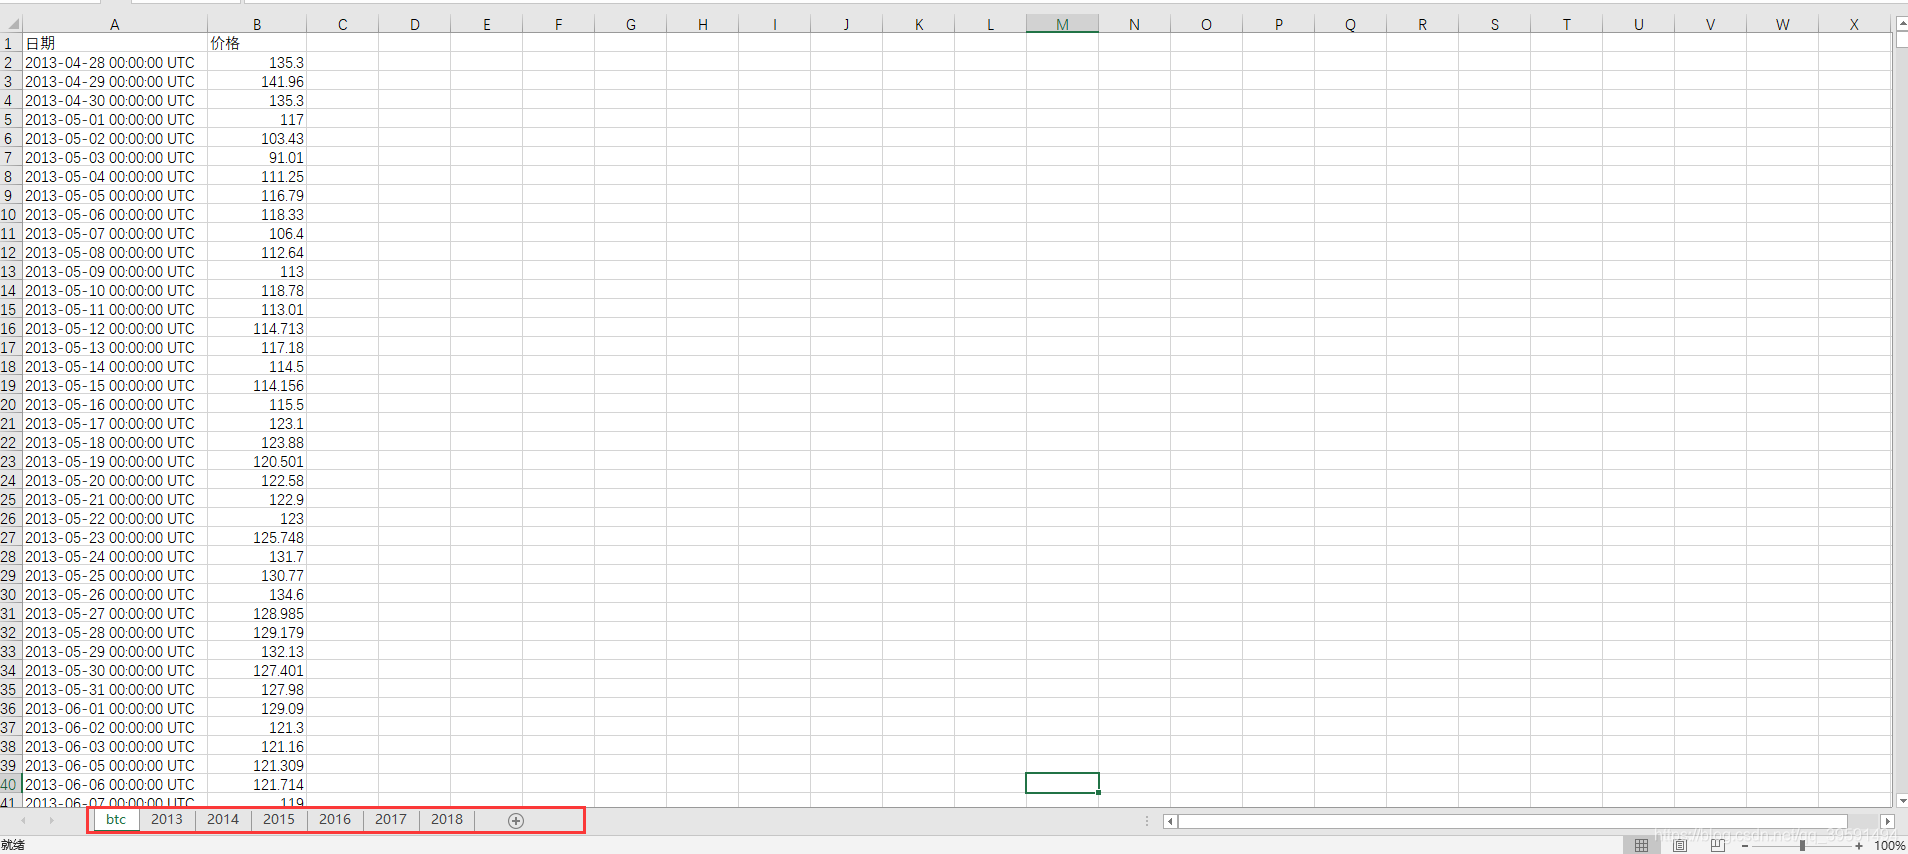
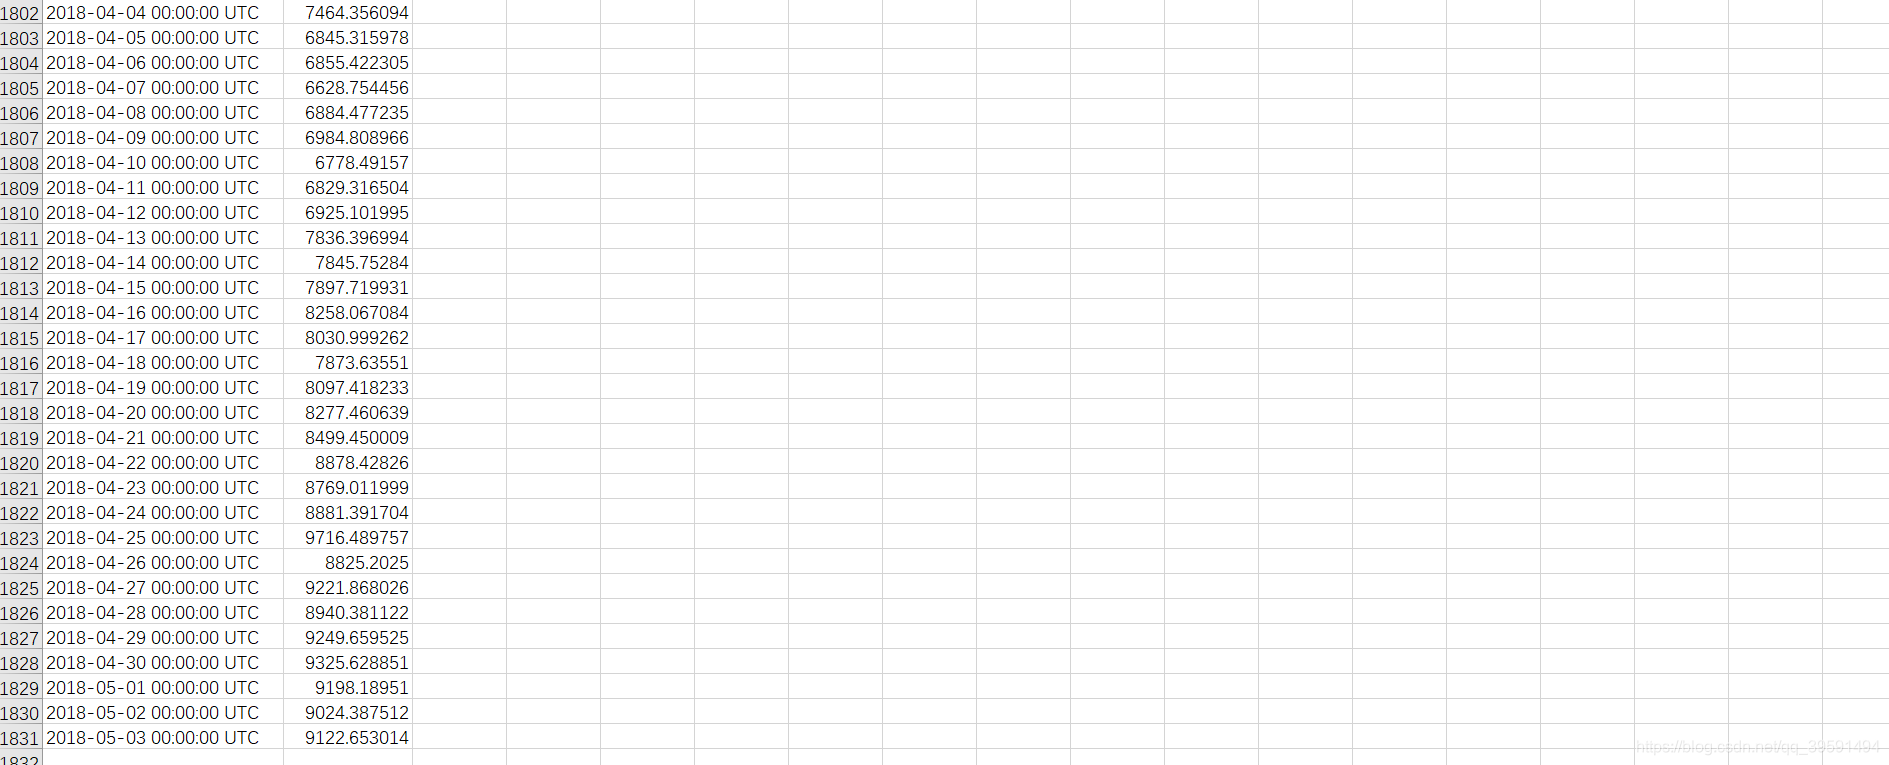
目前有一个excel表,其中里面有一个工作薄的名称为:btc,在这个工作薄中有2013年–2018年的所有交易数据,本文主要实现,将不同的年份的数据保存至新的工作薄并起名成为:2013,2014等等。

如果不用python进行操作的话,我们首先需要打开excel表,然后选择btc工作薄。新建2013 2014工作薄,最后进行分析导入,保存退出。在python操作中首先需要导入excel表,然后获取到btc工作薄中的数据,通过不同的时间年份来获取不同年份的数据,最后创建新的工作薄,导入–>保存退出:
1、导入内置库及第三方库
import os  #  用于获取excel文件路径,以及对分析后的excel文件进行保存
import openpyxl  #  使用openpyxl可以对excel进行操作,需要安装 pip install openpyxl
import datetime  #  日期
import time  #  时间
1.2、定义文件路径
year_list = [2013, 2014, 2015, 2016, 2017, 2018]
file_path = r"F:\python-office\log"
file_name = "btc.xlsx"
file_result = os.path.join(file_path, file_name)
1.3、定义函数
#!/usr/bin/env python
# -*- coding:utf-8 -*-
import os
import openpyxl
import datetime
import time
year_list = [2013, 2014, 2015, 2016, 2017, 2018]
file_path = r"F:\python-office\log"
file_name = "btc.xlsx"
file_result = os.path.join(file_path, file_name)
def excel():
"""
"""
wb = openpyxl.load_workbook(file_result) # 首先获取excel文件生成对象wb 使用openpyxl.load_workbook 方法
sh = wb.active # 使用wb中的active方法获取当前工作薄:btc 生成新的对象sh
index = 0 # 设置一个数字变量之后会用到
for i in range(len(year_list)): # 循环6次,6次来源于year_list列表长度
count = 2 # 定义一个数字变量 后面会用到
sh1 = wb.create_sheet(str(year_list[index])) # 使用使用wb.create 方法创建工作薄名称。名称为列表中的值,index是上面定义的数字变量
for rows in sh.rows: # 循环btc工作薄表中的内容
if rows[0].coordinate != "A1" and datetime.datetime.strptime(rows[0].value, '%Y-%m-%d %H:%M:%S %Z').year == year_list[index]:
# 把日期和金额去除从第二行开始循环, 使用datetime模块将获取的value1的时间字符串解析为时间元组。 最后取年值进行匹配
# print(rows[0].value, rows[1].value)
sh1["A1"] = "日期" # 写入日期
sh1["B1"] = "金额" # 写入金额
sh1["A" + str(count)] = rows[0].value # A + str(count) 第二行开始 写入
sh1["B" + str(count)] = rows[1].value
# print("in sh:", sh1["A" + str(count)].value, sh1["B" + str(count)].value)
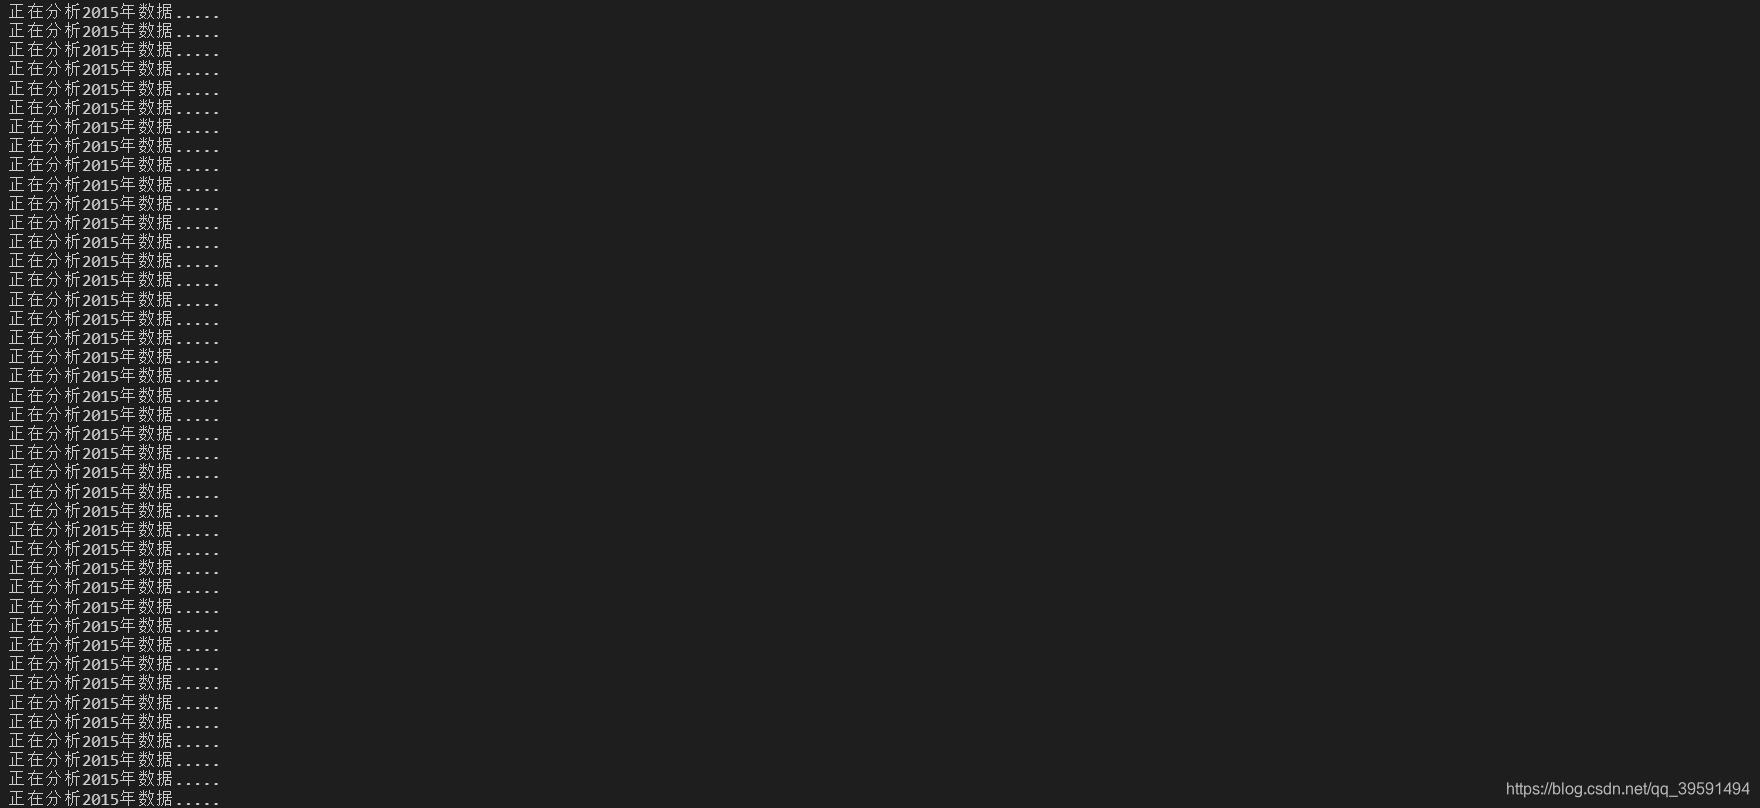
print(f"正在分析{year_list[index]}年数据.....")
count += 1 # 没完成一次循环 count + 1
index += 1 # 同时index + 1
wb.save("yankerp.xlsx") # 当函数全部执行完成后,使用wb.save 保存即可。
if __name__ == "__main__":
start_time = time.time()
excel()
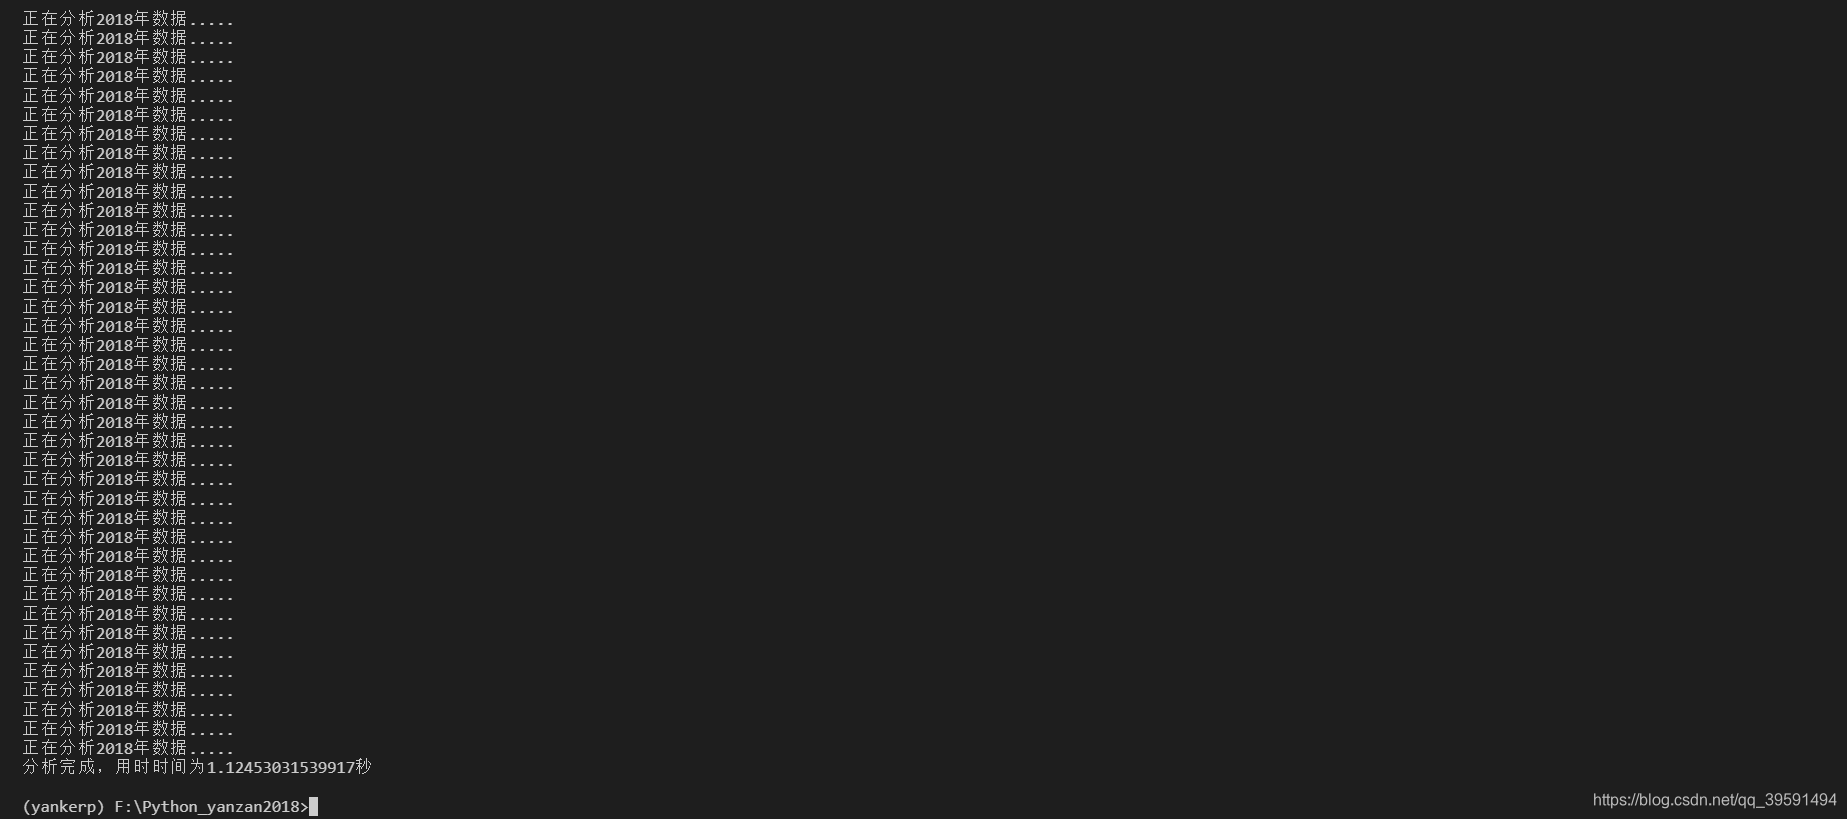
print(f"分析完成,用时时间为{time.time() - start_time}秒")
4、完整代码
#!/usr/bin/env python
# -*- coding:utf-8 -*-

import os
import openpyxl
import datetime
import time

year_list = [2013, 2014, 2015, 2016, 2017, 2018]
file_path = r"F:\python-office\log"
file_name = "btc.xlsx"
file_result = os.path.join(file_path, file_name)


def excel():
    """
    """
    wb = openpyxl.load_workbook(file_result)
    sh = wb.active
    index = 0
    for i in range(len(year_list)):
        count = 2
        sh1 = wb.create_sheet(str(year_list[index]))

        for rows in sh.rows:
            if rows[0].coordinate != "A1" and datetime.datetime.strptime(rows[0].value, '%Y-%m-%d %H:%M:%S %Z').year == year_list[index]:
                # print(rows[0].value, rows[1].value)
                sh1["A1"] = "日期"
                sh1["B1"] = "金额"
                sh1["A" + str(count)] = rows[0].value
                sh1["B" + str(count)] = rows[1].value

                # print("in sh:", sh1["A" + str(count)].value, sh1["B" + str(count)].value)
                print(f"正在分析{year_list[index]}年数据.....")
                count += 1
        index += 1
    wb.save("yankerp.xlsx")

if __name__ == "__main__":
    start_time = time.time()
    excel()
    print(f"分析完成,用时时间为{time.time() - start_time}秒")
运行过程及结果: