参考用Python玩转微信(一),做了一些修改
import re
import os
import time
import itchat
from echarts import Echart, Legend, Pie
import wordcloud
from wordcloud import WordCloud, ImageColorGenerator
import jieba
import numpy as np
import PIL.Image as Img
import matplotlib.pyplot as plt


# 登录,发送消息到filehelper
# itchat.login()
# itchat.send(u'hello', 'filehelper')

# 登录状态保存,但似乎还是弹出二维码
itchat.auto_login(hotReload=True)
itchat.dump_login_status()

# 微信好友男女比例
friends = itchat.get_friends(update=True)[0:]
# 男,女,其他,总人数,friends[0]是自己
male = female = other = 0
for i in friends[1:]:
    sex = i['Sex']
    if sex == 1:
        male += 1
    elif sex == 2:
        female += 1
    else:
        other += 1
total = len(friends[1:])

# 百分比圆饼图
chart = Echart(u'{}微信好友性别比例'.format(friends[0]['NickName']), 'from WeChat')
chart.use(Pie('WeChat',
              [
                  {'value': male, 'name': u'男性 %.2f%%' % (float(male)/total*100)},
                  {'value': female, 'name': u'女性 %.2f%%' % (float(female) / total * 100)},
                  {'value': other, 'name': u'不明 %.2f%%' % (float(other) / total * 100)},

              ],
            radius = ['50%', '70%']
            ))
chart.use(Legend(['male', 'female', 'other']))
del chart.json['xAxis']
del chart.json['yAxis']
chart.plot()
# 登录
itchat.login()
# 好友个性签名
signature_ls = []
friends = itchat.get_friends(update=True)[:]
for friend in friends:
    signature = friend['Signature'].strip()
    signature = re.sub('<span.*?</span>', '', signature)
    signature_ls.append(signature)
# 长签名字符串
raw_signatures = ''.join(signature_ls)
# print(raw_signatures)

# jieba分词,注意分词后要用' '连接起来
text = jieba.cut(raw_signatures, cut_all=True)
text = ' '.join(text)
text = text.replace('\n', '')
# print(text)


# 默认颜色和样式
my_wordcloud = WordCloud(background_color='white',
                         max_words=2000,
                         max_font_size=40,
                         random_state=42,
                         font_path=r'C:\Windows\Fonts\ARIALUNI.TTF'
                         ).generate(text)

plt.imshow(my_wordcloud)
plt.axis('off')
plt.show()

# 选择图片模板做颜色和样式
dr = os.path.dirname(__file__)
coloring = np.array(Img.open(os.path.join(dr, 'hdImg.jpg')))
my_wordcloud = WordCloud(background_color='white',
                         max_words=2000,
                         mask=coloring,
                         max_font_size=50,
                         random_state=42,
                         font_path=r'C:\Windows\Fonts\ARIALUNI.TTF'
                         ).generate(text)

image_colors = ImageColorGenerator(coloring)
plt.imshow(my_wordcloud.recolor(color_func=image_colors))
plt.imshow(my_wordcloud)
plt.axis('off')
plt.show()

# 保存到文件,发送到filehelper
my_wordcloud.to_file('wechat_cloud.png')
itchat.send_image('wechat_cloud.png', 'filehelper')

# 装饰器自动回复文本消息
@itchat.msg_register('Text')
def reply(msg):
    if not msg['FromUserName'] == myUserName:
        # 将消息备份到filehelper
        itchat.send_msg(u'{}收到{}的消息{}'.format(
                                                    time.strftime('%Y-%m-%d %H:%M:%S'),
                                                    msg['User']['NickName'],
                                                    msg['Text']), 'filehelper')
	# 如果是好友appium发来的消息,回复‘thankyou’
        if msg['User']['NickName'] == 'appium':
            return 'thankyou'


if __name__ == '__main__':
    itchat.auto_login()
    myUserName = itchat.get_friends(update=True)[0]['UserName']
    # 自动回复消息
    itchat.run()
Geopy模块几乎用不了,使用百度AK获取指定地区的经纬度,但是百度热图实例打不开,最终用高德地图热图实例实现。。。
注意json还是要用json库的dumps实现,自己瞎编辑的json格式无法识别,估计无法正确读入.js文件的json数据吧。。。。
# coding=gbk
import itchat
import requests
import json
# 获取微信好友城市列表,去掉未设置城市的好友的空串''
itchat.auto_login()
friends = itchat.get_friends(update=True)[:]
citys = []
for friend in friends:
if friend['City'] != '':
citys.append(friend['City'])
# 申请百度的AK,取得微信好友的经纬度
def geocode(address):
url = 'http://api.map.baidu.com/geocoder/v2/?address=' \
+ address + '&output=json&ak=7LpPYrfuXuGdDmRELo2TSsLenCKtvdMi'
response = requests.get(url)
data = response.json()
# 返回经纬度字典
return data['result']['location']
# 将经纬度,添加"value"=1,作为热点保存到列表中
points = []
for city in citys:
location = geocode(city)
location['value'] = 1
points.append(location)
# 将字典的列表转成json格式,赋值到wechat_heatmap.html的heatmapData.js文件中: var heatmapData = ...
points_json = json.dumps(points)
print(points_json)
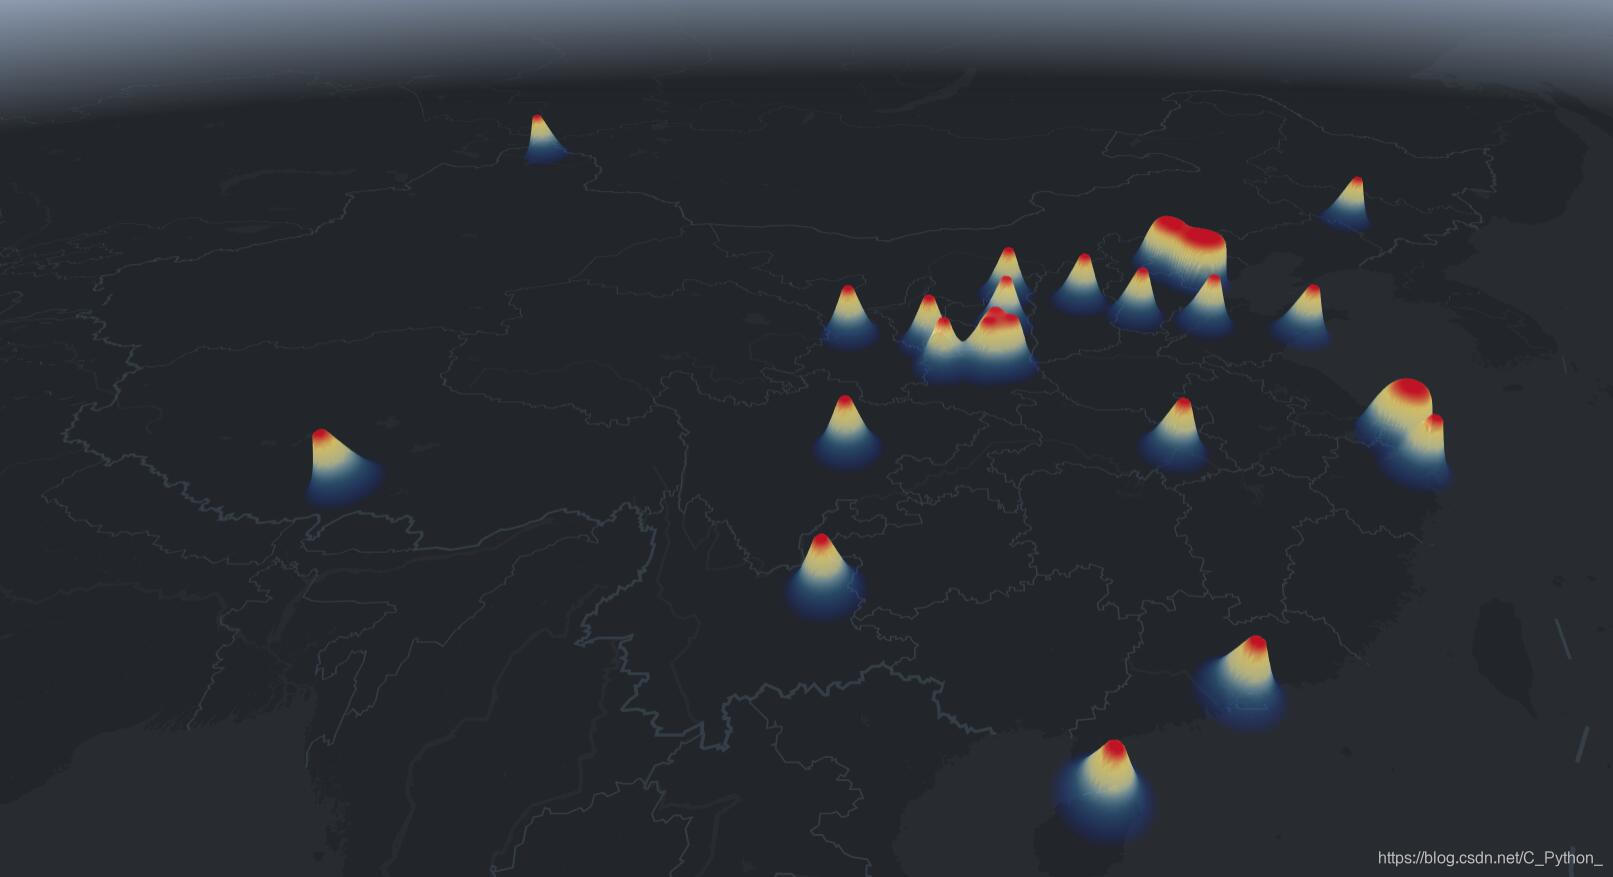
# 最后在wechat_heatmap.html复制高德热力图实例源码 https://lbs.amap.com/api/loca-api/demos/loca_heatmap/loca_heatmap_3d/
# wechat_heatmap.html中添加高德地图申请的web端Key
# <script src="//webapi.amap.com/loca?v=1.2.0&key=8e801b290ca8dae42e46e36c72f2bfa3"></script>
# <script src="heatmapData.js"></script>
# .js和.html文件在同级,打开html文件即可查看热力图