版权声明:更多内容:http://www.findme.wang ;本文地址: https://blog.csdn.net/hsd2012/article/details/60599841
图表绘制
使用Highcharts进行图表绘制相当简单,且官方文档也非常详细。由于Highcharts是在Jquery基础上开发的,所以得提前引入Jquery,为了简便,所有需要引入的文件直接从bootsrtp的 CDN 库中引入。
下面是两个案例:
<html>
<head>
<meta http-equiv="Content-Type" content="text/html; charset=utf-8" />
<title>无标题</title>
<script src="http://cdn.bootcss.com/jquery/3.1.0/jquery.min.js"></script>
<script src="http://cdn.bootcss.com/highcharts/5.0.7/highcharts.js"></script>
</head>
<body>
<div id="container" style="width:auto; height:auto;"></div>
<script type="text/javascript">
$(function () {
$('#container').highcharts({
chart: {
type: 'column',
inverted: true,
borderWidth: 0,
},
title: {
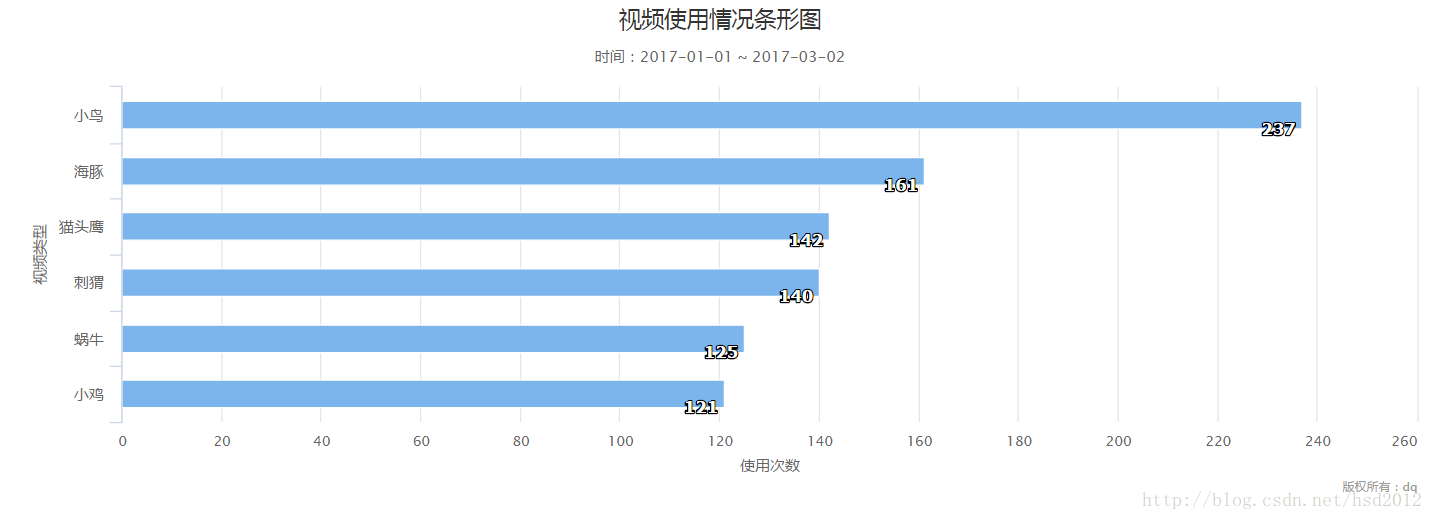
text: '视频使用情况条形图'
},
subtitle: {
text: '时间:2017-01-01 ~ 2017-03-02'
},
xAxis: {
type: 'category',
labels: {
style: {
fontSize: '12px',
fontFamily: 'Verdana, sans-serif'
}
},
title: {
text: '视频类型'
}
},
yAxis: {
min: 0,
title: {
text: '使用次数'
}
},
legend: {
enabled: false
},
series: [{
name: '播放次数:',
data: [
['小鸟', 237],
['海豚', 161],
['猫头鹰', 142],
['刺猬', 140],
['蜗牛', 125],
['小鸡', 121]
],
dataLabels: {
enabled: true,
color: '#FFFFFF',
align: 'right',
y: 10, // 10 pixels down from the top
style: {
fontSize: '13px',
fontFamily: 'Verdana, sans-serif'
}
}
}],
credits :{
href : 'http://www.findme.wang',
text : '版权所有:dq'
},
exporting : false
});
});
</script>
</body>
</html>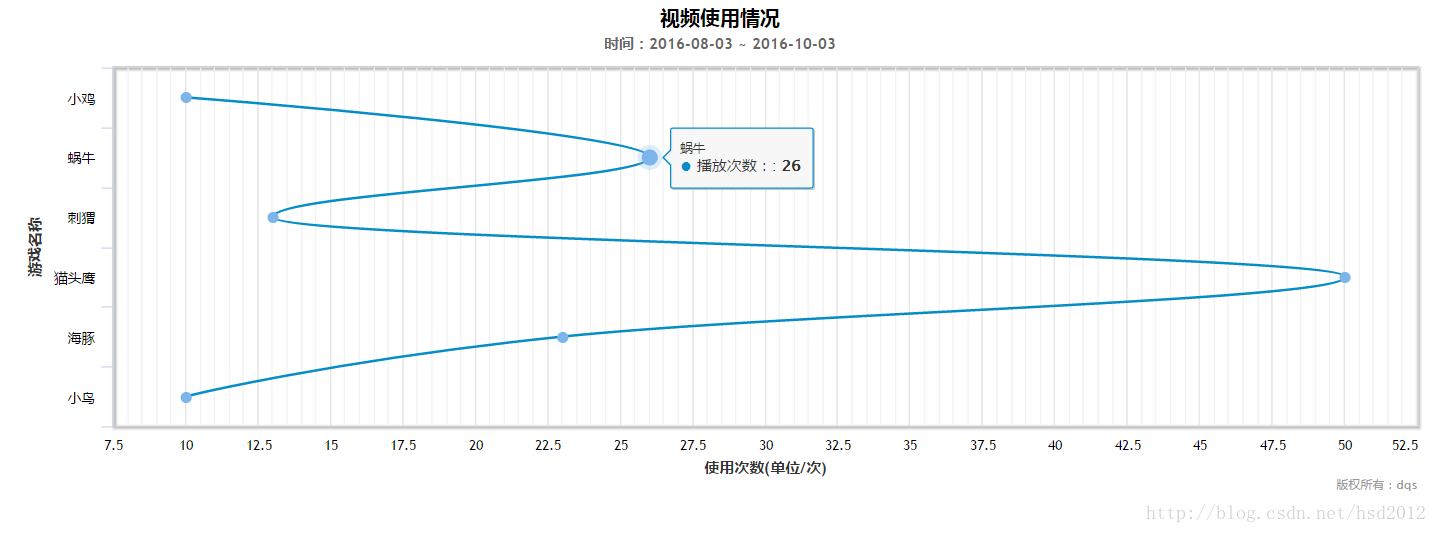
<html>
<head>
<meta http-equiv="Content-Type" content="text/html; charset=utf-8" />
    <title>无标题</title>
    <script src="http://cdn.bootcss.com/jquery/3.1.0/jquery.min.js"></script>
    <script src="http://cdn.bootcss.com/highcharts/5.0.7/highcharts.js"></script>
</head>
<body>
<!--
https://api.hcharts.cn/highcharts
https://www.hcharts.cn/demo/highcharts/bar-basic
 -->
<div id="container"></div>
<script type="text/javascript">
$(function () {
    $('#container').highcharts({
        chart: {
            type: 'spline',
            borderWidth: 0,
            inverted: true, //是否翻转坐标轴
        },
        title: {
            text: '视频使用情况'
        },
        subtitle: {
            text: '时间:2016-08-03  ~  2016-10-03 '
        },
        xAxis: {
            'type' : 'category',
            reversed: false,
            title: {
                enabled: true,
                text: '游戏名称'
            },
            categories : ['小鸟', '海豚','猫头鹰', '刺猬','蜗牛', '小鸡'],
            showLastLabel: true,
        },
        yAxis: {
            allowDecimals: false,
            title: {
                text: '使用次数(单位/次)'
            },
            plotLines: [{
                value: 0,
                width: 1,
                color: '#808080'
            }]
        },
        legend: {
            enabled: false
        },
        series: [{
            name: '播放次数:',
            data: [10,23,50,13,26,10]
        }],
        credits :{
            href : 'http://www.findme.wang',
            text : '版权所有:dq'
        },
        exporting : false
    });
});
</script>
</body>
</html>
补充
官方api:https://api.hcharts.cn/highcharts
里面包含了很多参数详细的描述
官方案例:
https://www.hcharts.cn/demo/highcharts/bar-basic