目录
一、简介
spring cloud对hystrix相关参数提供了一个实时监控的解决方案Hystrix Dashboard。Hystrix Dashboard提供了一个可视化界面,实时监控服务调用时的参数。当某个服务在一定时间内被调用失败次数达到配置的阈值时,熔断器转到半打开状态。这个时候,系统内部自己发送少量请求试探被调服务是否成功调用,如果还是不能成功,熔断器转到打开状态。如果调用成功,熔断器转到关闭状态。在半打开状态和打开状态,外部请求将不会调用失败的服务。这里分两篇文章来介绍。
《springCloud微服务系列——断路监控第一篇——仪表盘》
《springCloud微服务系列——断路监控第二篇——聚合监控信息》
二、配置
服务端
新建一个工程,用来管理hystrix
-
POM
<dependency>
    <groupId>org.springframework.cloud</groupId>
    <artifactId>spring-cloud-starter-netflix-hystrix</artifactId>
</dependency>

<dependency>
    <groupId>org.springframework.cloud</groupId>
    <artifactId>spring-cloud-starter-netflix-hystrix-dashboard</artifactId>
</dependency>

<dependency>
    <groupId>org.springframework.boot</groupId>
    <artifactId>spring-boot-starter-security</artifactId>
</dependency>

<dependency>
    <groupId>org.springframework.boot</groupId>
    <artifactId>spring-boot-starter-actuator</artifactId>
</dependency>-
注解
启动类上加上@EnableHystrixDashboard注解
-
安全
spring:
  application:
    name: turbine-server
  profiles:
    active: dev
  security:
    user:
      name: 用户名
      password: 密码

management:
  server:
    port: 8118
    servlet:
      context-path: /manage/turbine/admin
  endpoints:
    web:
      exposure:
        include: "*"
客户端
客户端即使用hystrix的服务
-
POM
<dependency>
    <groupId>org.springframework.cloud</groupId>
    <artifactId>spring-cloud-starter-netflix-hystrix</artifactId>
</dependency>

<dependency>
    <groupId>org.springframework.boot</groupId>
    <artifactId>spring-boot-starter-security</artifactId>
</dependency>

<dependency>
    <groupId>org.springframework.boot</groupId>
    <artifactId>spring-boot-starter-actuator</artifactId>
</dependency>-
注解
启动类上加上@EnableCircuitBreaker和@EnableHystrixDashboard注解
-
feign
feign:
  hystrix:
    enabled: true
  compression:
    request:
      enabled: true
    response:
      enabled: true
    mime-types: text/xml,application/xml,application/json
min-request-size: 2048-
hystrix
hystrix:
  command:
    default:
      execution:
        isolation:
          thread:
timeoutInMilliseconds: 8000 #(1 + MaxAutoRetries + MaxAutoRetriesNextServer) * ReadTimeout -
安全
spring:
  application:
    name: trace-demo1-server
  profiles:
    active: dev
  security:
    user:
      name: 用户名
      password: 密码

management:
  server:
    port: 8188
    servlet:
      context-path: /trace-demo1/admin
  endpoints:
    web:
      exposure:
        include: "*"
三、使用
这个时候访问/actuator/hystrix.stream节点,出现如下页面
我们测试是否正常需要调用一个使用了hystrix的任意一个服务,然后再访问/actuator/hystrix.stream
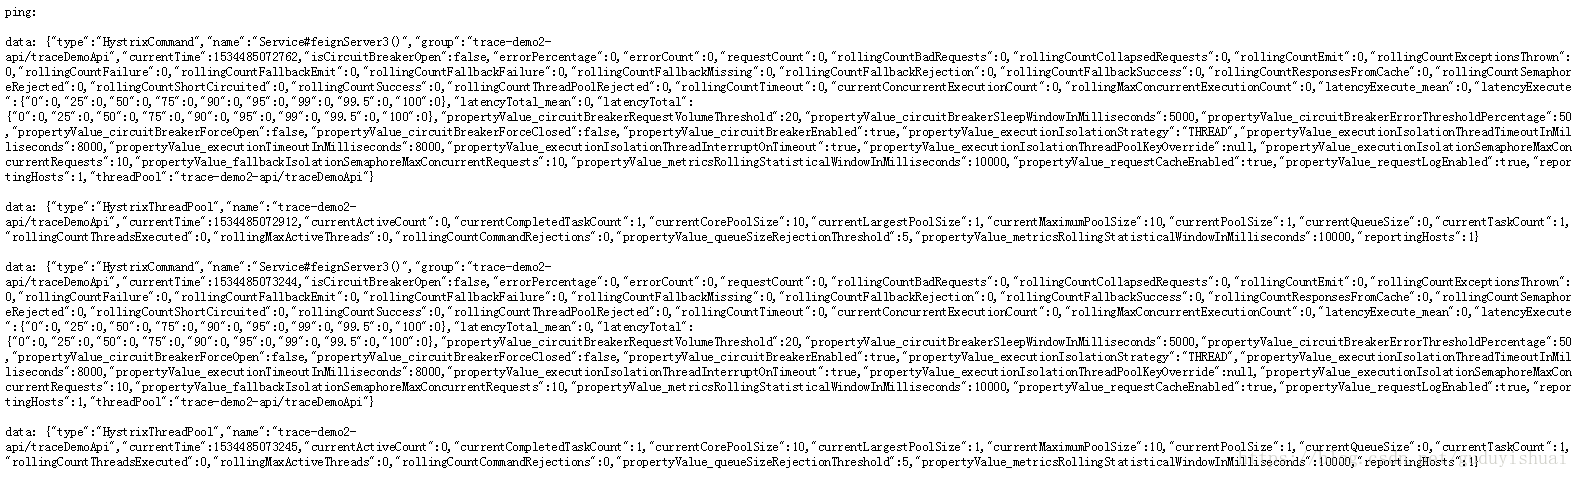
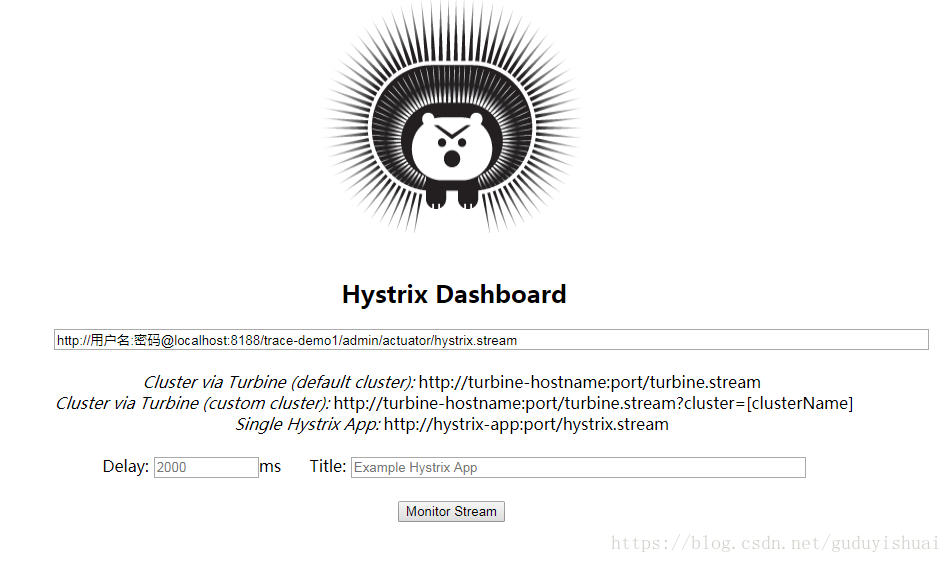
我们需要把json数据转换成可视化界面
访问服务端页面http://localhost:8818/manage/turbine/hystrix即可进入管理页面主页,在监控地址栏中输入需要监控的服务的/actuator/hystrix.stream节点,注意需要加上用户名和密码
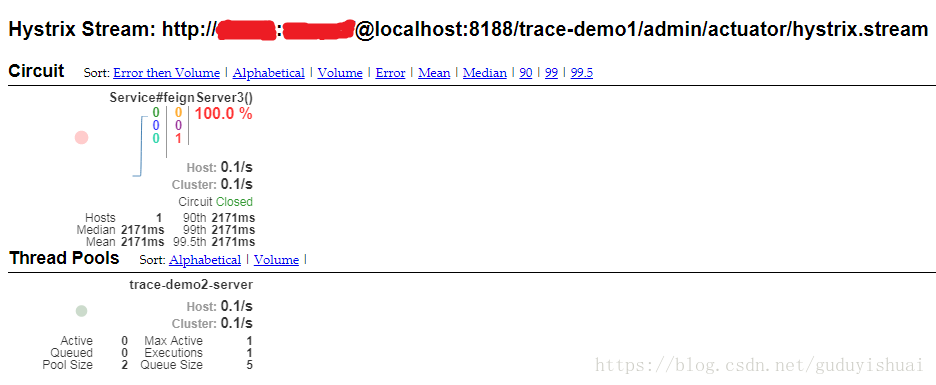
点击Monitor Stream即可进入该服务的监控界面
四、常见错误
我们在搭建的过程中,可能会经常遇到连接不上的错误
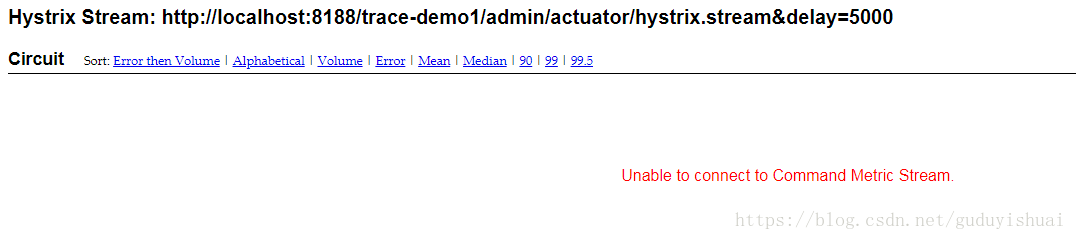
我们可以这样来排除,先在浏览器中调用该服务的/actuator/hystrix.stream节点看是否正常。如果存在问题,有可能是没有开启/actuator功能,或者开启了/actuator功能,没有暴露/hystrix.stream节点。如果/actuator配置正常,那么看是否引入了hystrix相关的jar包,是否开启了hystrix,是否在启动类上加上了@EnableCircuitBreaker和@EnableHystrixDashboard注解。如果/actuator/hystrix.stream节点不存在问题,那么查看监控主页面填写服务地址栏的地方是否加上了正确的用户名,密码信息。