Hystrix仪表板可以显示每个断路器(被@HystrixCommand注解的⽅法)的状态,Hystrix相关数据,⽐如有多少请求、多少成功、多少失败、多少降级等
前言
正常状态是UP,跳闸是⼀种状态CIRCUIT_OPEN,可以通过/health查看,前提是⼯程中需要引⼊
SpringBoot的actuator(健康监控)。已添加上父工程上
<dependency>
 <groupId>org.springframework.boot</groupId>
 <artifactId>spring-boot-starter-actuator</artifactId>
</dependency>
Dashboard控仪表盘准备
准备环境
- 在m-parent的基础上新建module mvn 项目
m-cloud-hystrix-dashboard-9000 - 导入依赖
<dependencies>
        <!--hystrix-->
        <dependency>
            <groupId>org.springframework.cloud</groupId>
            <artifactId>spring-cloud-starter-netflix-hystrix</artifactId>
        </dependency>
        <!--hystrix 仪表盘-->
        <dependency>
            <groupId>org.springframework.cloud</groupId>
            <artifactId>spring-cloud-starter-netflix-hystrix-dashboard</artifactId>
        </dependency>
        <dependency>
            <groupId>org.springframework.cloud</groupId>
            <artifactId>spring-cloud-starter-netflix-eureka-client</artifactId>
        </dependency>
    </dependencies>
- 启动类添加
@EnableHystrixDashboard激活仪表盘
@SpringBootApplication
@EnableDiscoveryClient
@EnableHystrixDashboard //开启HystrixDashboard
public class HystrixDashboard9000 {


    public static void main(String[] args) {


        SpringApplication.run(HystrixDashboard9000.class, args);
    }
}
- application.yml
server:
  port: 9000

spring:
  application:
    name: m-cloud-hystrix-dashboard

#注册发现
eureka:
  client:
    service-url:
      defaultZone: http://CloudEurekaServerA:8761/eureka,http://CloudEurekaServerB:8762/eureka
  instance:
    prefer-ip-address: true
    instance-id: ${

    spring.cloud.client.ip-address}:${

    spring.application.name}:${

    server.port}:@project.version@
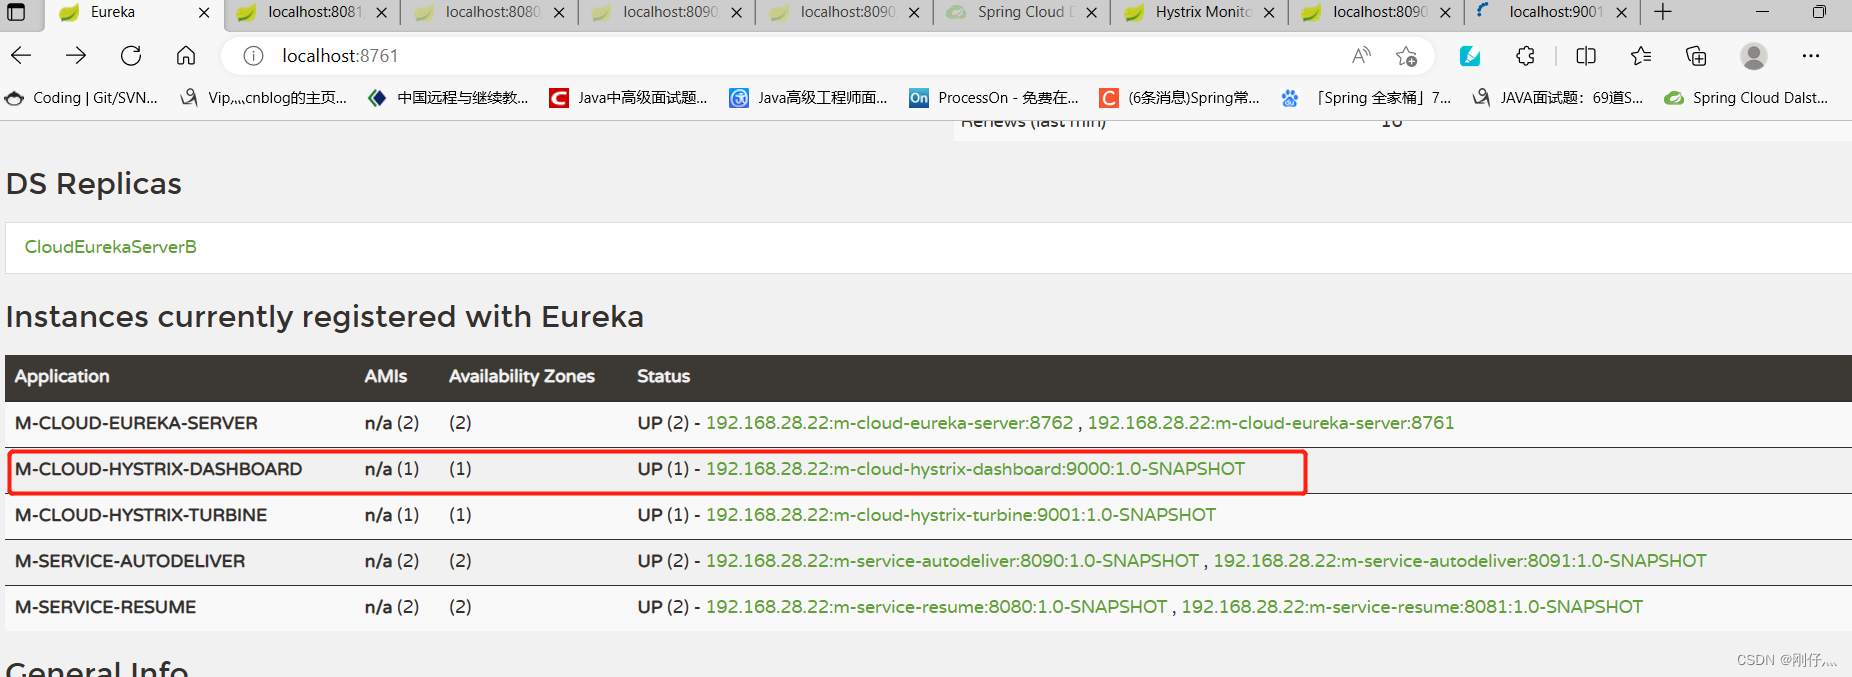
- 在被监测的微服务中注册监控servlet(如:m-service-autodeliver)
@Bean
    public ServletRegistrationBean getServlet() {


        HystrixMetricsStreamServlet streamServlet = new
                HystrixMetricsStreamServlet();
        ServletRegistrationBean registrationBean = new
                ServletRegistrationBean(streamServlet);
        registrationBean.setLoadOnStartup(1);
        registrationBean.addUrlMappings("/actuator/hystrix.stream");
        registrationBean.setName("HystrixMetricsStreamServlet");
        return registrationBean;
    }
- 启动项目,访问http://localhost:8090/actuator/hystrix.stream
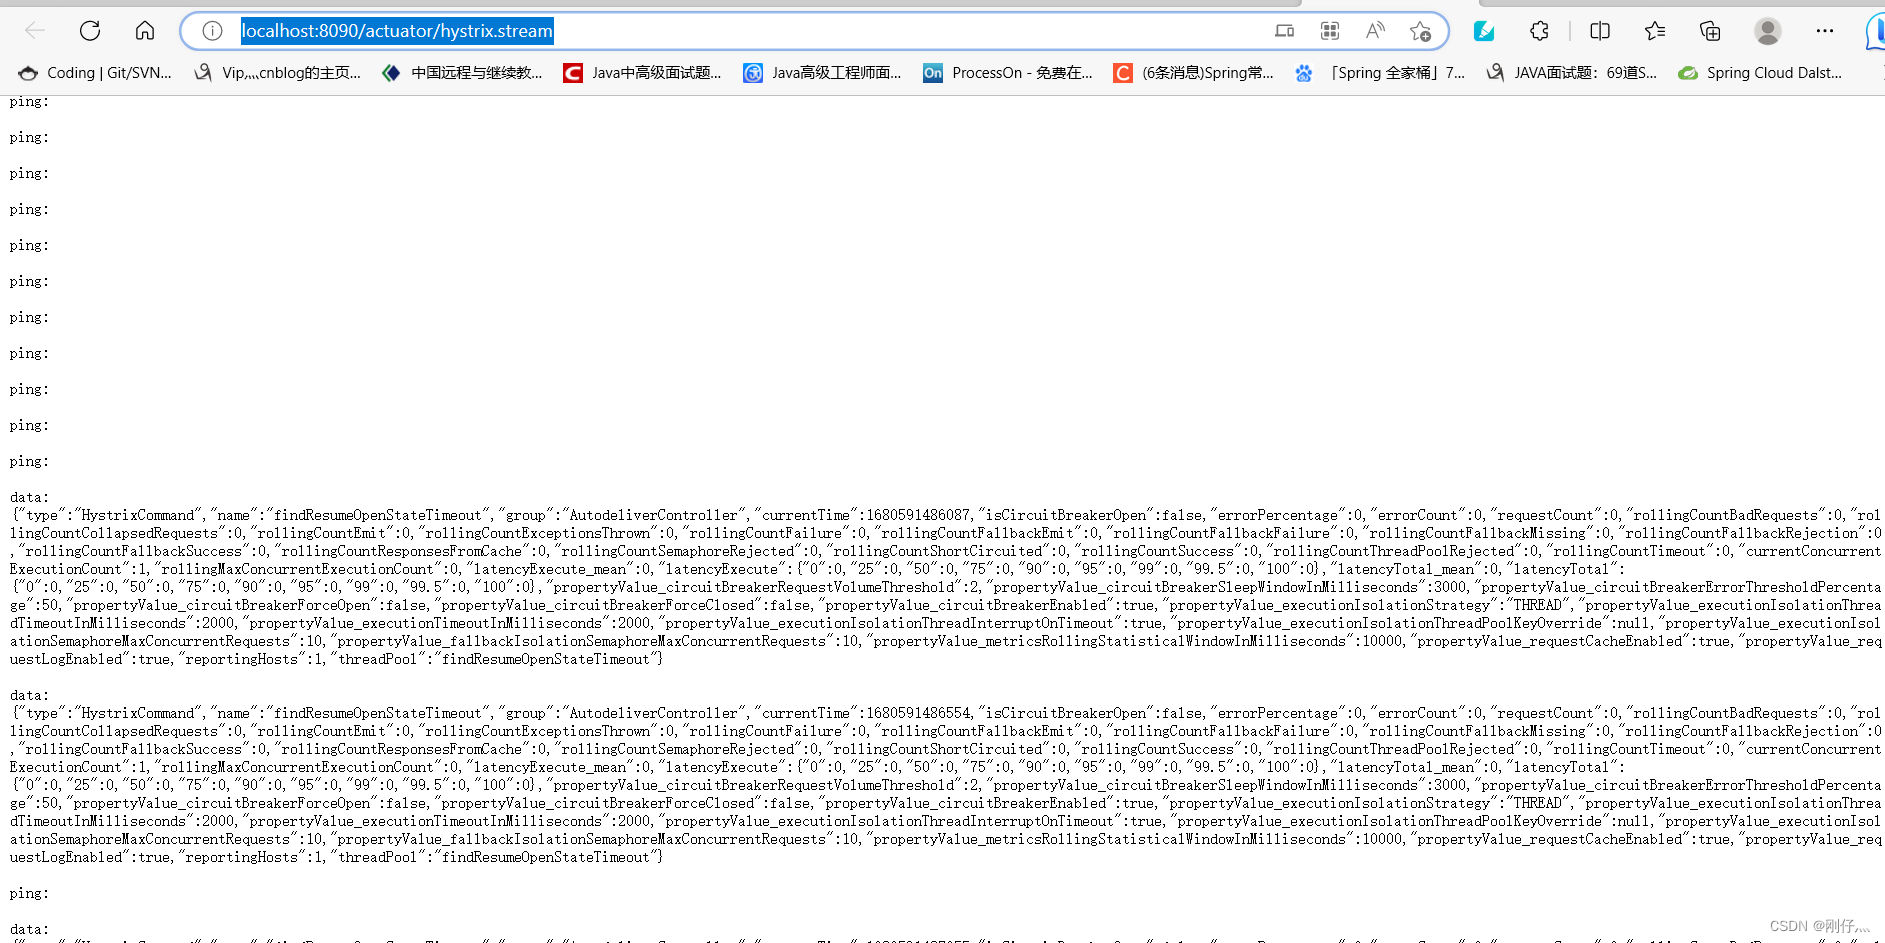
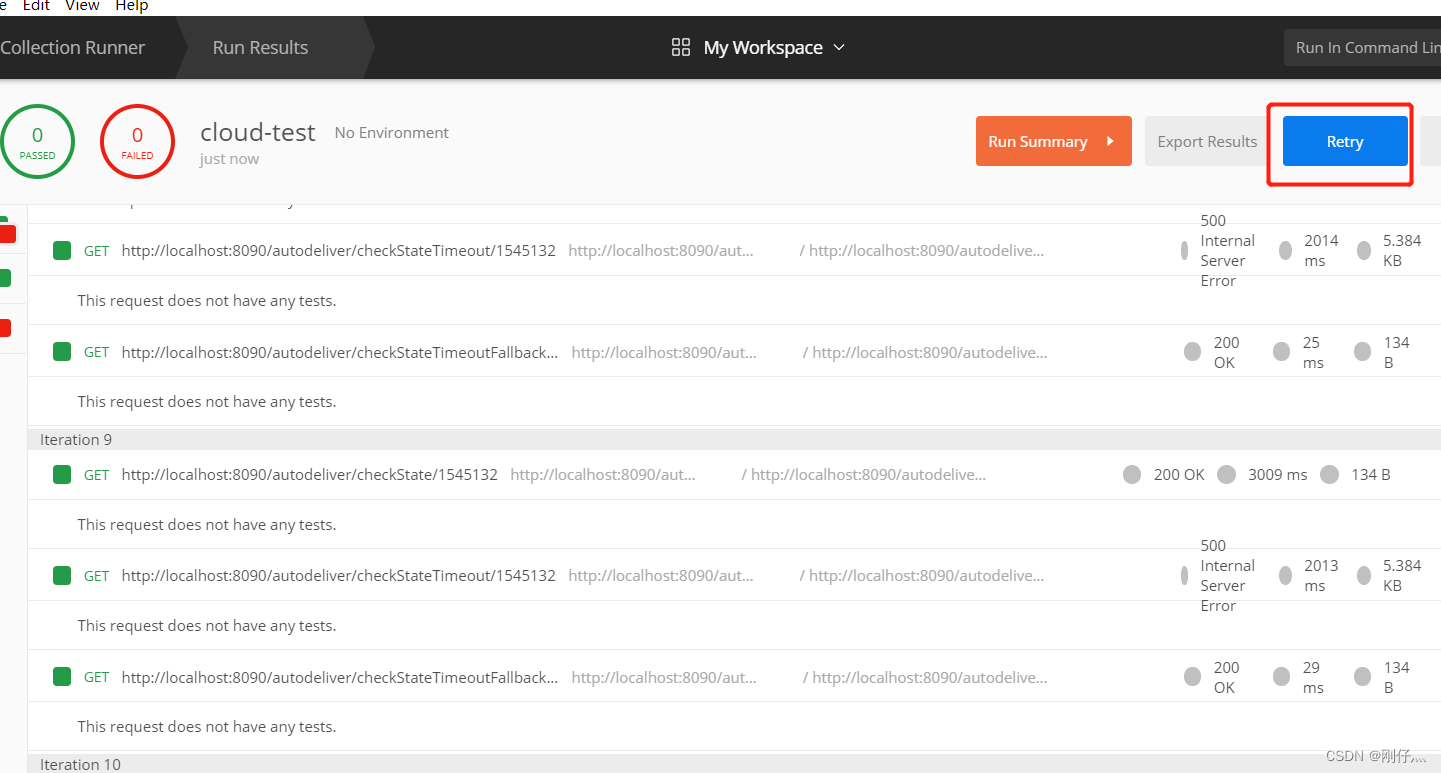
postMan 调用消费者服务
- 访问测试http://localhost:9000/hystrix
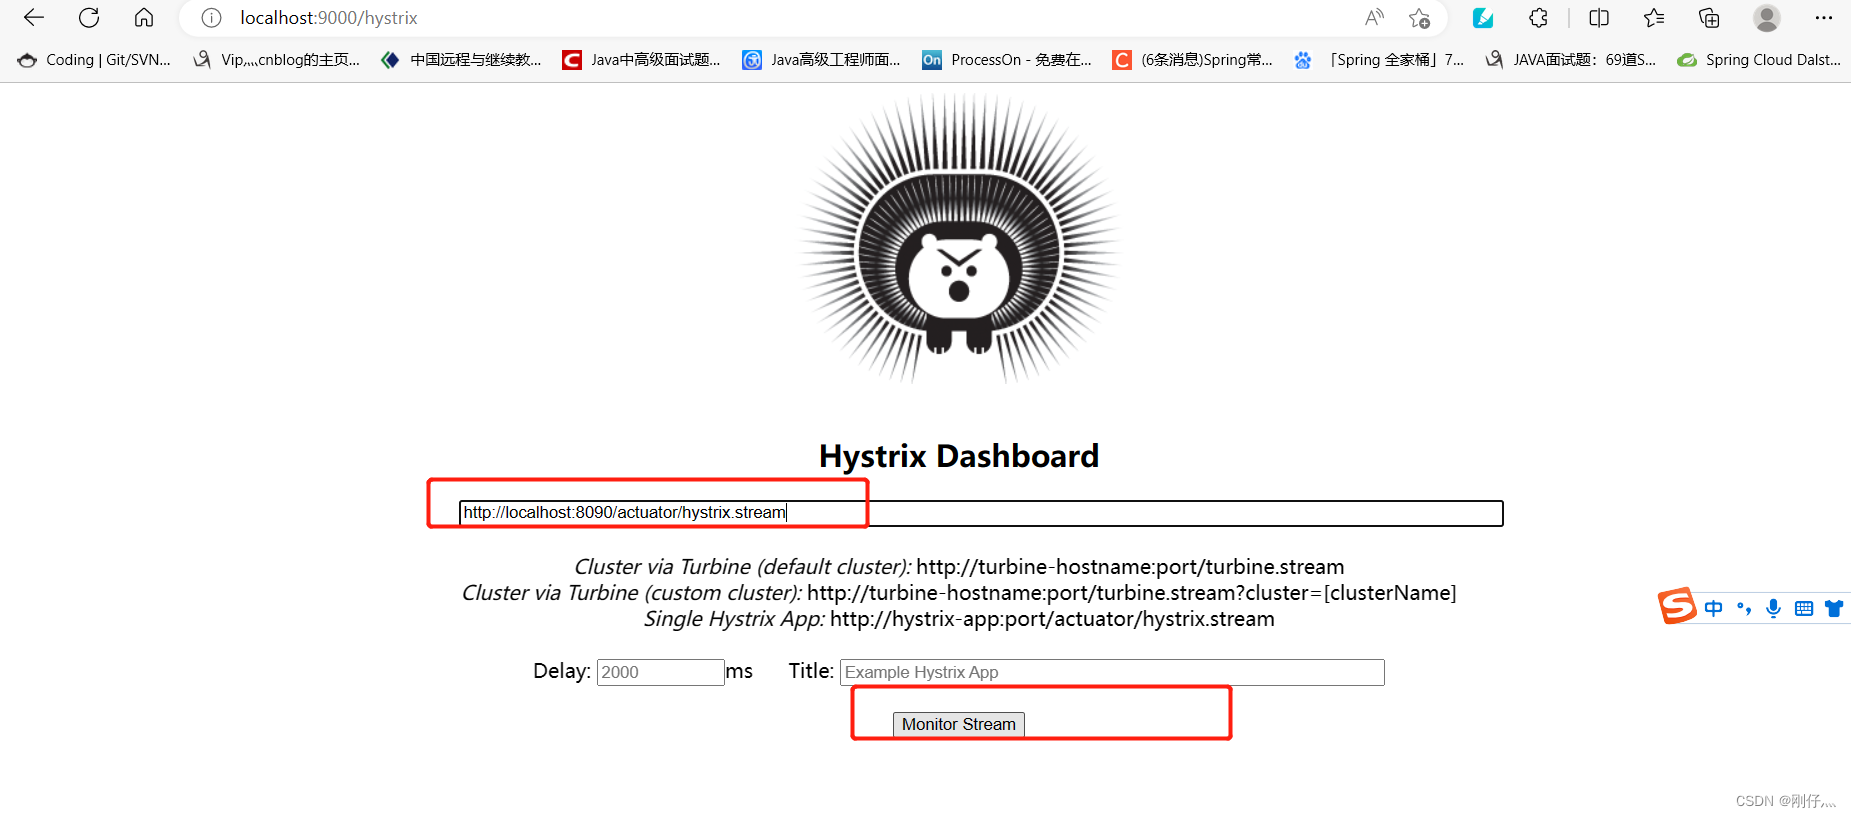
8.postMan 调用消费者服务 retry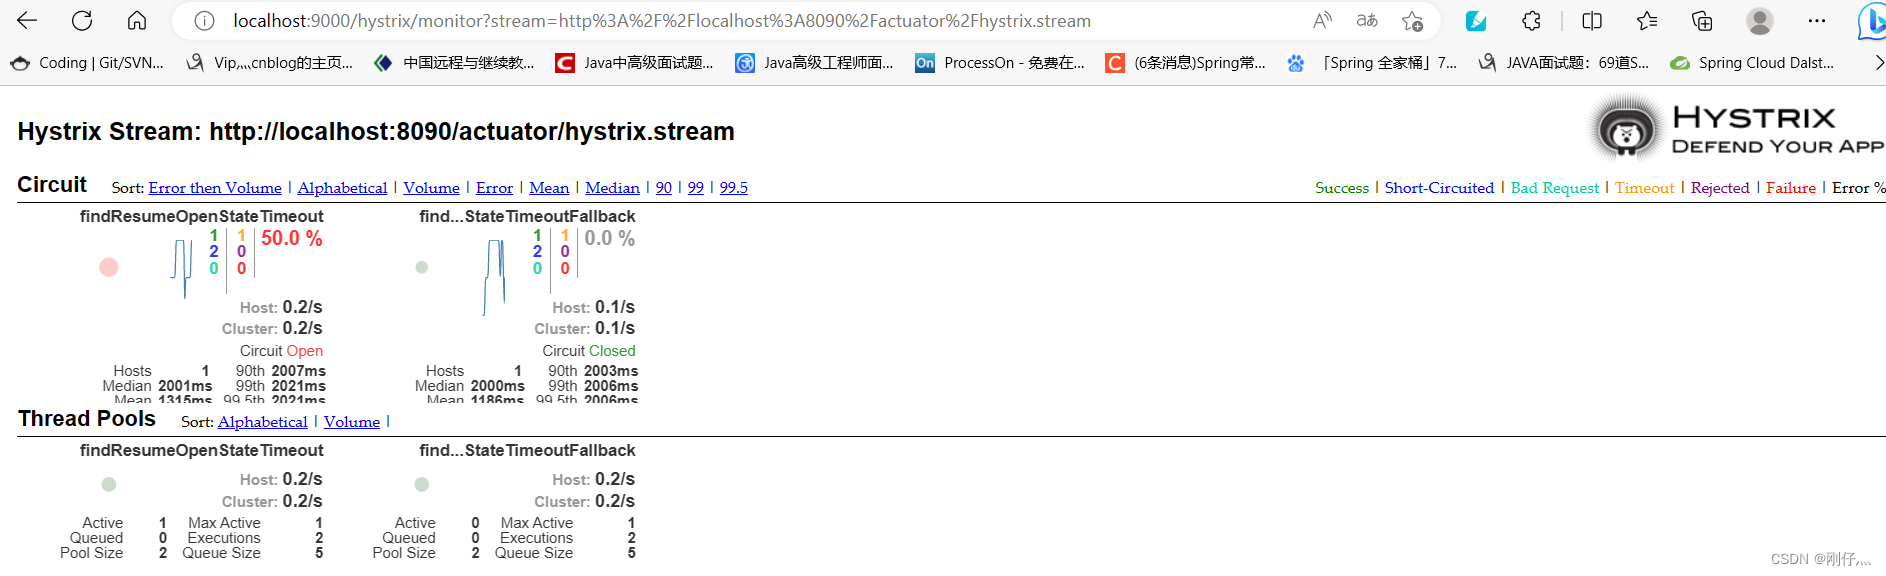
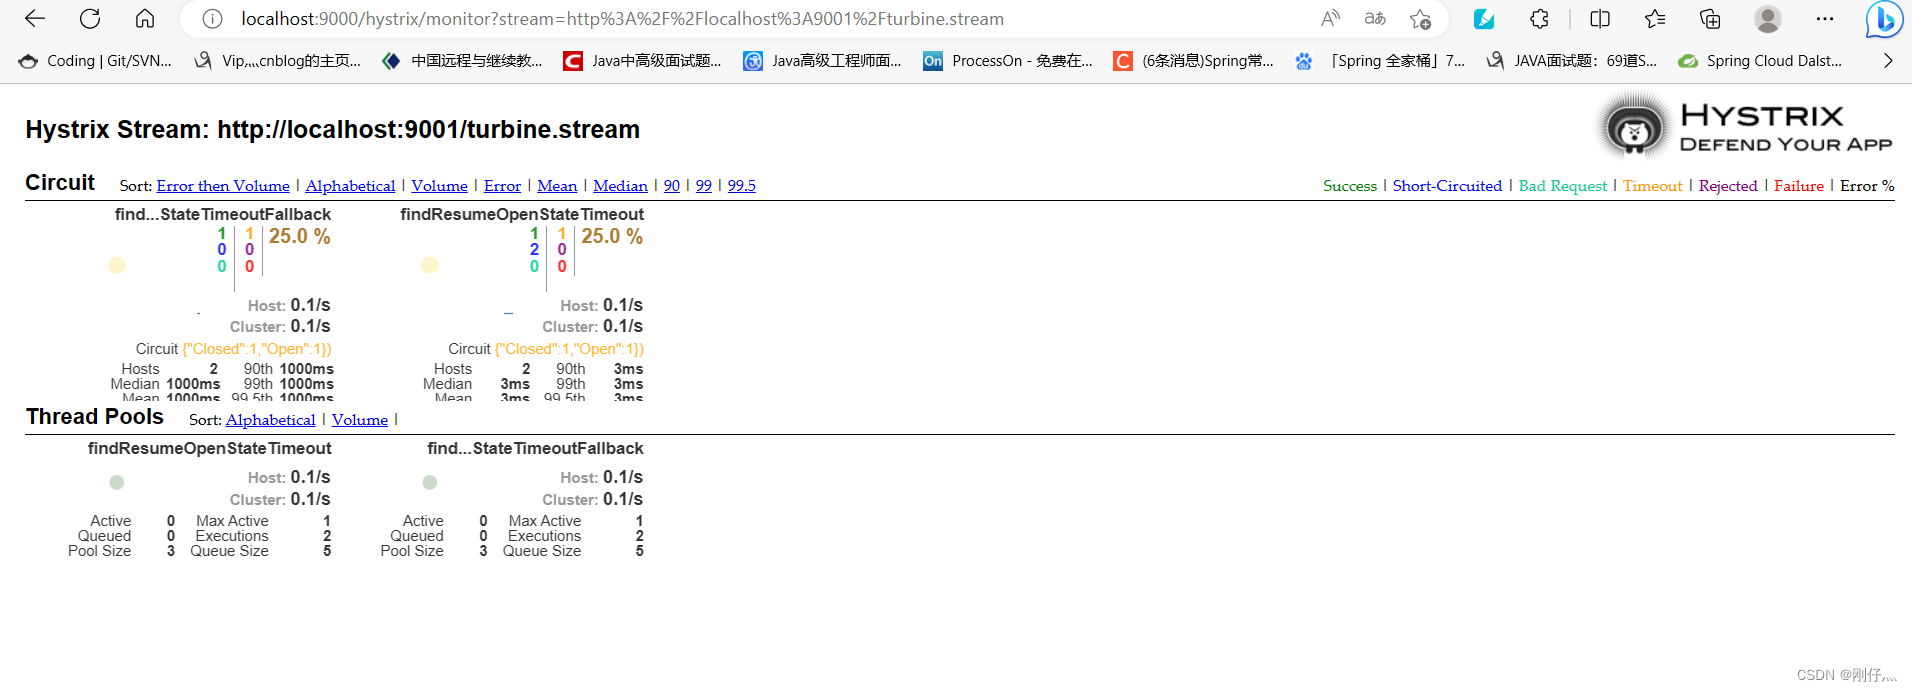
Dashboard仪表盘解读
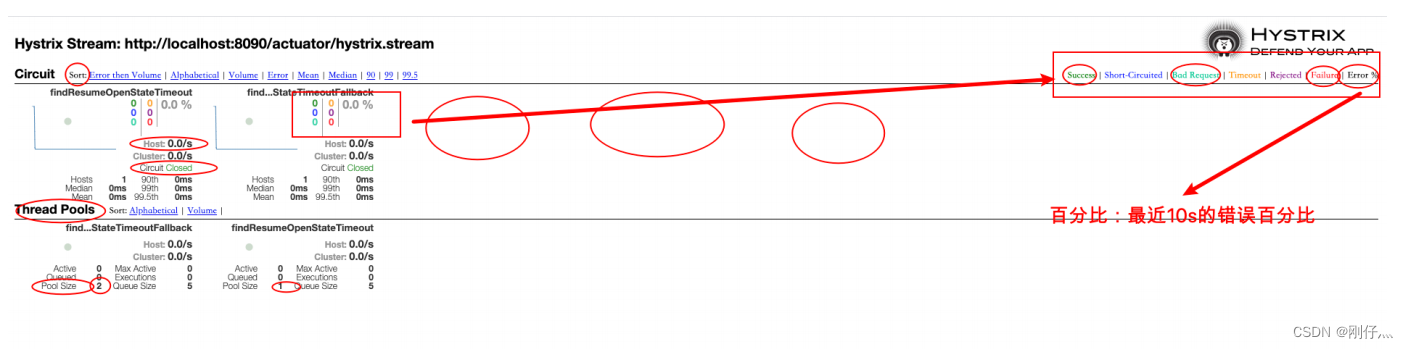
百分比,10s内错误请求百分⽐
实心圆:
大小:代表请求流量的⼤⼩,流量越⼤球越⼤
颜⾊:代表请求处理的健康状态,从绿⾊到红⾊递减,绿⾊代表健康,红⾊就代表很不健康
曲线波动图:
记录了2分钟内该⽅法上流量的变化波动图,判断流量上升或者下降的趋势
Dashboard聚合监控解读
之前,我们针对的是⼀个微服务实例的Hystrix数据查询分析,在微服务架构下,⼀个微服务的实例往往
是多个(集群化)
⽐如⾃动投递微服务
实例1(hystrix) ip1:port1/actuator/hystrix.stream
实例2(hystrix) ip2:port2/actuator/hystrix.stream
实例3(hystrix) ip3:port3/actuator/hystrix.stream
按照已有的⽅法,我们就可以结合dashboard仪表盘每次输⼊⼀个监控数据流url,进去查看
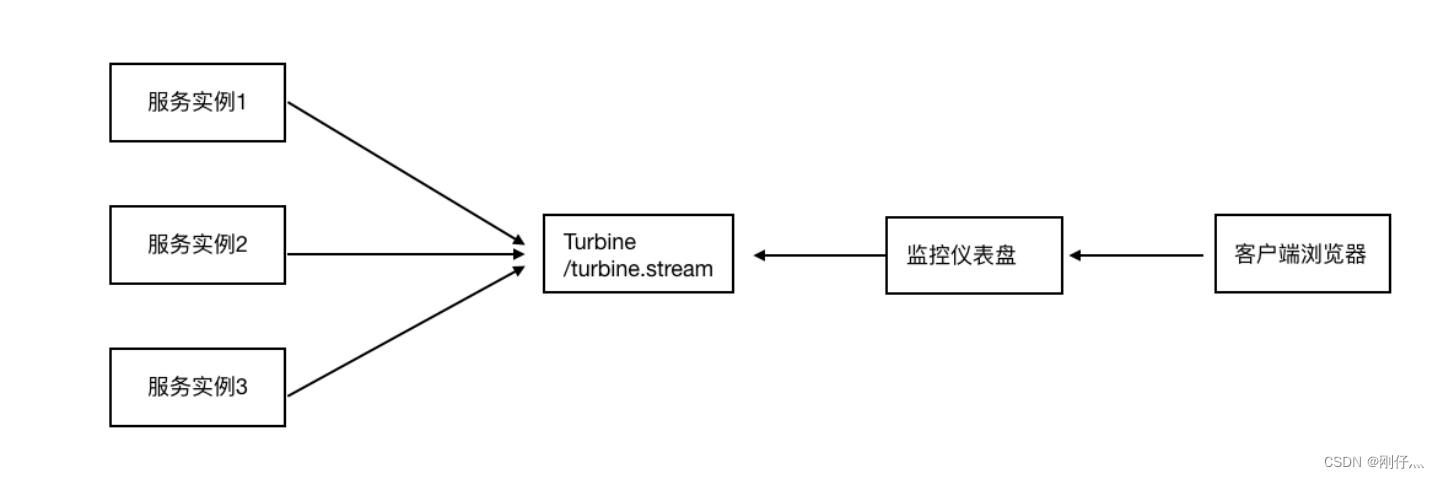
⼿⼯操作能否被⾃动功能替代?Hystrix Turbine聚合(聚合各个实例上的hystrix监控数据)监控
Turbine(涡轮)
思考:微服务架构下,⼀个微服务往往部署多个实例,如果每次只能查看单个实例的监控,就需要经常
切换很不⽅便,在这样的场景下,我们可以使⽤ Hystrix Turbine 进⾏聚合监控,它可以把相关微服务
的监控数据聚合在⼀起,便于查看
准备环境
- 在m-parent的基础上新建module mvn 项目
m-cloud-hystrix-turbine-9001 - 导入依赖
    <dependencies>
        <!--hystrix turbine聚合监控-->
        <dependency>
            <groupId>org.springframework.cloud</groupId>
            <artifactId>spring-cloud-starter-netflix-turbine</artifactId>
        </dependency>
        <dependency>
            <groupId>org.springframework.cloud</groupId>
            <artifactId>spring-cloud-starter-netflix-eureka-client</artifactId>
        </dependency>
    </dependencies>
- 启动类添加
@EnableTurbine激活仪表盘
@SpringBootApplication
@EnableDiscoveryClient
@EnableTurbine //开启 Turbine
public class HystrixTurbine9001 {


    public static void main(String[] args) {


        SpringApplication.run(HystrixTurbine9001.class,args);
    }
}
- application.yml
server:
  port: 9001

spring:
  application:
    name: m-cloud-hystrix-turbine

#注册发现
eureka:
  client:
    service-url:
      defaultZone: http://CloudEurekaServerA:8761/eureka,http://CloudEurekaServerB:8762/eureka
  instance:
    prefer-ip-address: true
    instance-id: ${

    spring.cloud.client.ip-address}:${

    spring.application.name}:${

    server.port}:@project.version@

#turbine配置
turbine:
  # appCofing配置需要聚合的服务名称,⽐如这⾥聚合⾃动投递微服务的hystrix监控数据
  # 如果要聚合多个微服务的监控数据,那么可以使⽤英⽂逗号拼接,⽐如 a,b,c
  appConfig: m-service-autodeliver
  clusterNameExpression: "'default'" # 集群默认名称
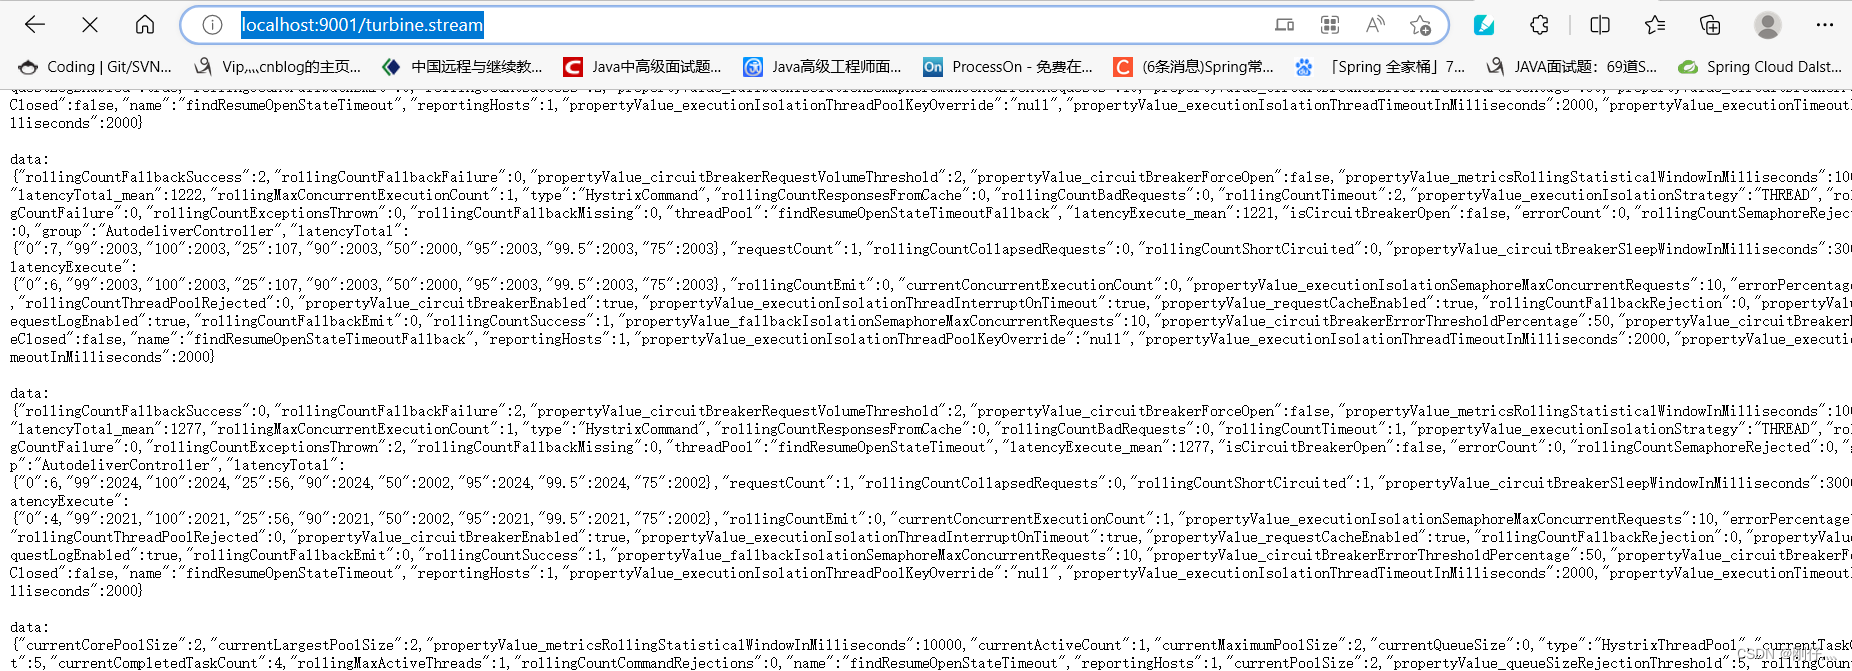
-
浏览器访问Turbine项⽬,http://localhost:9001/turbine.stream,就可以看到监控数据了(没有数据postMan retry)
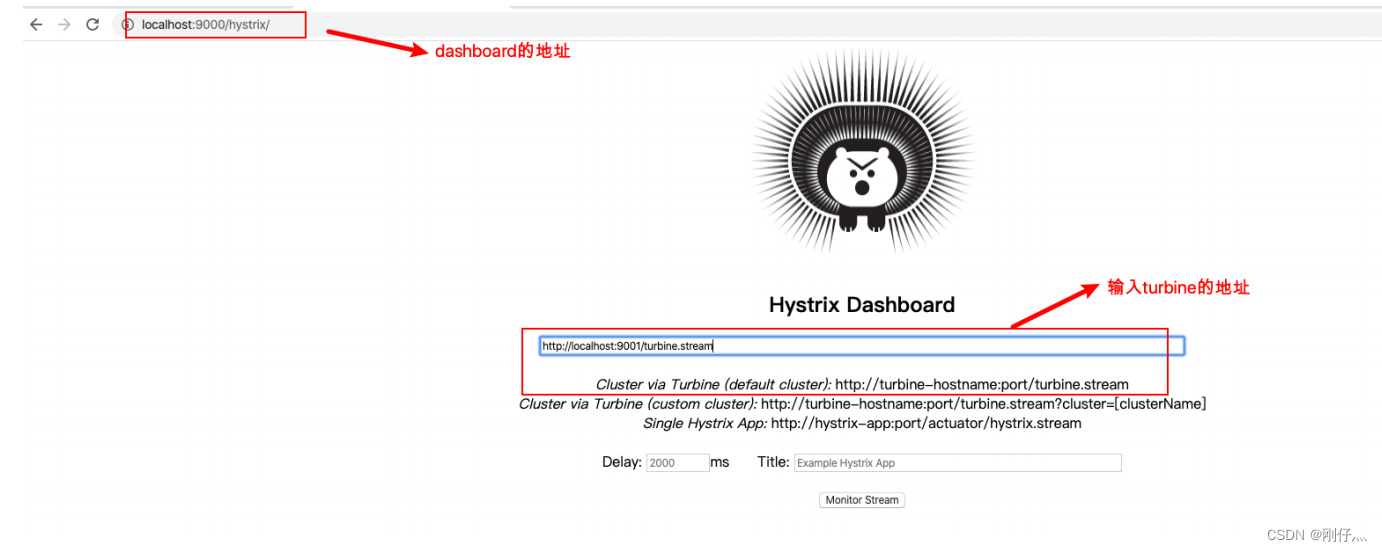
-
通过dashboard的⻚⾯查看数据更直观,把刚才的地址输⼊dashboard地址栏
-
复制一份m-service-autodeliver-8090修改为 m-service-autodeliver-8091,添加到m-parent 工程,postMan 访问8090,8091的接口
-
重启服务
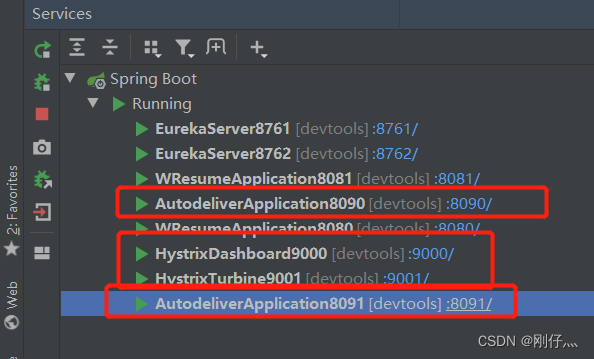
依次stop 以上服务,重启顺序8090-8091-9000-9001 -
访问接口

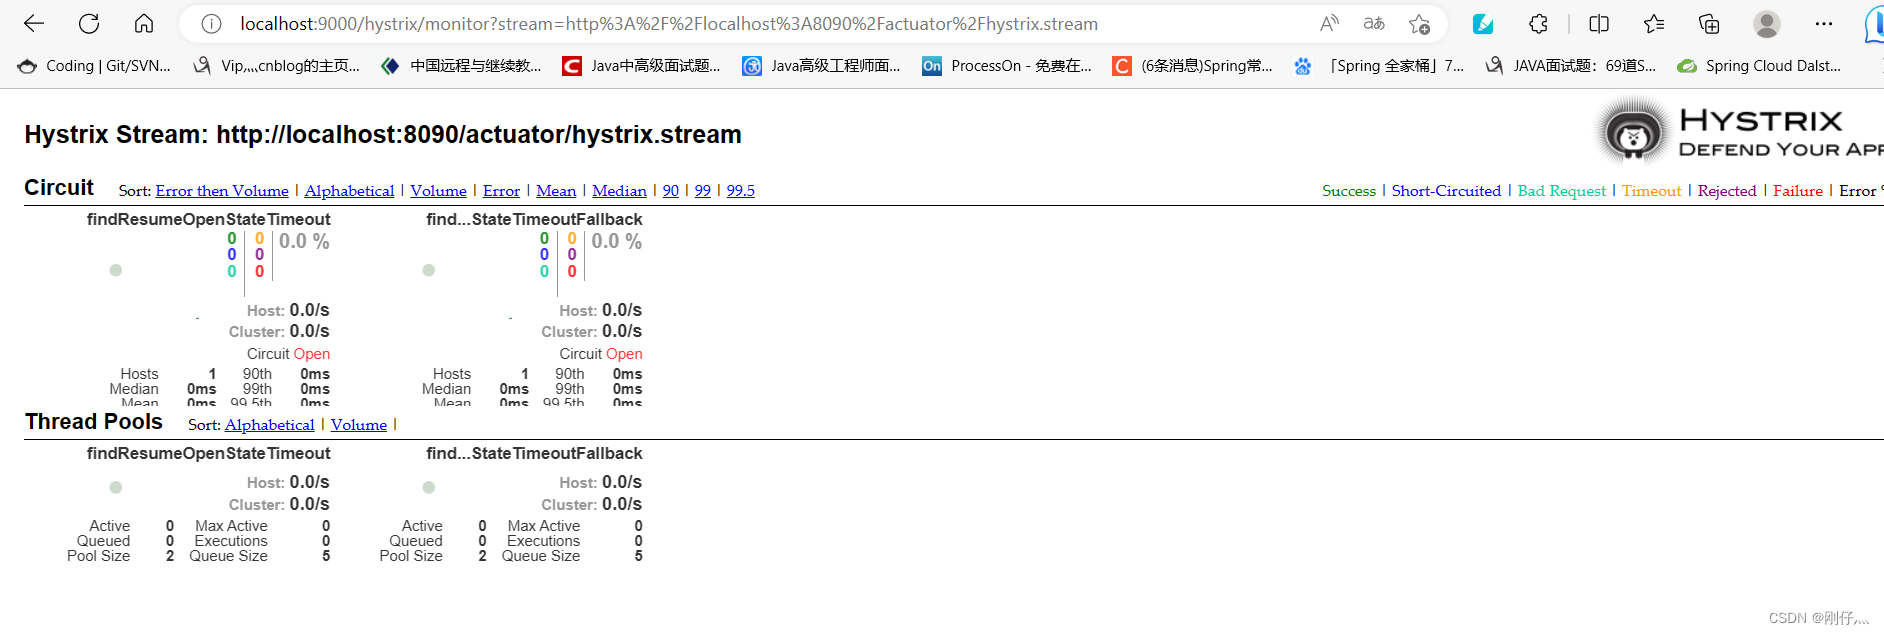
-
监控⻚⾯