版权声明:本文为博主原创文章,未经博主允许不得转载。 https://blog.csdn.net/u010278305/article/details/42809619
本笔记说明如何对叠加物体的数量进行计数,并对其进行分割。
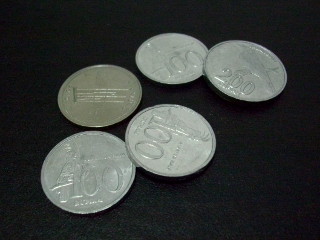
本文算法思路参考了Nash的思路,图像也是采用Nash的图像,为叠加硬币,链接:http://opencv-code.com/tutorials/count-and-segment-overlapping-objects-with-watershed-and-distance-transform/
本文涉及到的主要知识点如下:
1、距离变换。
2、基于分水岭变换的分割。
其中,本文采用基于标记符控制的分水岭分割,源该算法的思路来自冈萨雷斯的数字图像处理(MATLAB版)(第二版)。
算法过程如下:
1、对原始图像进行二值化。
2、对二值化后的图像进行距离变换,并归一化到0~1。
3、对距离变换以0.5为阈值进行二值化,之后获得连通分量的数量即为硬币的数量。
4、用sobel算子求梯度的幅度(因为梯度幅度图像沿物体边缘有较大模值,故理想情况下,对梯度图像进行分水岭变换可得到沿物体边缘的分水岭脊线)。
5、用最小覆盖技术处理图像,使得局部最小区域仅出现在标记过的位置(不然会导致过分割,使脊线出现在不该出现的位置)。
6、进行分水岭变换。
本文对应的matlab源代码如下:
%function:
%       用距离变换获得叠加硬币的数量,并用分水岭变换对叠加的硬币进行分割
%referrence:
%       http://opencv-code.com/tutorials/count-and-segment-overlapping-objects-with-watershed-and-distance-transform/
%       冈萨雷斯,数字图像处理(MATLAB版)(第二版)
%date:2015-1-17
%author:chenyanan
%转载请注明出处:http://blog.csdn.net/u010278305

%清空变量,读取图像
clear;close all
src = imread('images/watershed-disttrans-src-img.jpg');

figure('name','Process'),
%显示原始图像
subplot(2,2,1),imshow(src),title('src'),

%转换为灰度图像
gray=rgb2gray(src);
gray = im2double(gray);
subplot(2,2,2),imshow(gray),title('gray'),

%用ostu方法获取二值化阈值,进行二值化并进行显示
level=graythresh(gray);
bw=~im2bw(gray,level);
subplot(2,2,3),imshow(bw),title('bw'),

%Get the distance transform and normalize the result to [0,1] so we can visualize and threshold it,
dist = bwdist(bw);
maxDist=max(max(dist));
dist=dist./maxDist;
dist=im2bw(dist,0.5);

%获取边界,得到连通边界的数量
[B,Lbound] = bwboundaries(dist,'noholes');
ncomp = length(B);

titlenum=sprintf('coins:%d',ncomp);
subplot(2,2,4),imshow(dist),title(titlenum),

%Create the marker image for the watershed algorithm.
markers=dist;
%We also need to draw the background marker.
%Assuming that the objects located at the center of the image,
%we simply draw a marker near the border.
markers(2:8,2:8)=1;

%用sobel算子来求梯度模值
%梯度幅值在物体边缘有较大值,通过对梯度模值进行分水岭变换,
%理想情况下,可得到沿物体边缘的分水岭脊线
h=fspecial('sobel');
g=sqrt(imfilter(gray,h,'replicate').^2+...
       imfilter(gray,h','replicate').^2);

%由于存在大量的局部最小值,直接应用watershed会导致过度分割,故先用最小覆盖技术处理图像,
%使得局部最小区域仅出现在标记过的位置
g2 = imimposemin(g,markers);

%Perform the watershed algorithm.
L=watershed(g2);

%将分水岭的像素值改为255
f2=gray;
f2(L==0)=255;

%绘制识别结果
figure('name','Result');
subplot(1,2,1),imshow(f2),title('watershed pixels'),

%用不同颜色来标记每个前景物体和背景
dst = label2rgb(L);
subplot(1,2,2),imshow(dst);title('watershed region'),
运行结果如下:


源图像如下: