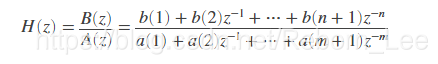
zplane
Zero-pole plot for discrete-time systems
Syntax
zplane(b,a)
zplane(, where b,a)b and a are row vectors, first uses roots to find the zeros and poles of the transfer function represented by the numerator coefficients b and the denominator coefficients a.
zplane(b,a),其中b和a是行向量,首先使用根来找到由分子系数b和分母系数a表示的传递函数的零和极点。
b, a — Transfer function coefficients
row vectors
Transfer function coefficients, specified as row vectors. The transfer function is defined in terms of z^–1:
例子:
已知一因果系统差分方程:
y(n) = 0.9 y(n - 1) + x(n);
使用zplane函数画出零极点图:
题解:有差分方程即可看出传递函数的分子和分母系数,之后应用zplane函数即可画出零极点图:
clc;clear;close all;

b = [1,0];
a = [1,-0.9];

zplane(b,a);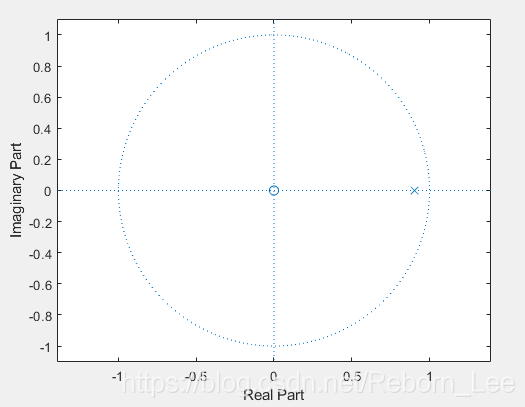
暂时只用到了上面的,下面的语法用到了再查。
zplane(z,p)
[hz,hp,ht] = zplane(___)
zplane(d)
[vz,vp,vk] = zplane(d)
Description
zplane( plots the zeros specified in column vector z,p)z and the poles specified in column vector p in the current figure window. The symbol 'o' represents a zero and the symbol 'x'represents a pole. The plot includes the unit circle for reference.
If z and p are matrices, then zplane plots the poles and zeros in the columns of z and p in different colors.
[ returns vectors of handles to the zero lines, hz,hp,ht] = zplane(___)hz, and the pole lines, hp. ht is a vector of handles to the axes/unit circle line and to text objects, which are present when there are multiple zeros or poles.
zplane( finds the zeros and poles of the transfer function represented by the digital filter, d)d. Use designfilt to generate d based on frequency-response specifications. The pole-zero plot is displayed in fvtool.
[ returns the zeros (vector vz,vp,vk] = zplane(d)vz), poles (vector vp), and gain (scalar vk) corresponding to the digital filter d.