使用网关之后我们面临的一个问题就是监控,我们需要知道网关的实时状态,比如当前的请求吞吐量、请求耗费的时间、请求峰值甚至需要知道具体哪个服务的哪个方法花费了多少时间。网关作为请求的中转点是监控品牌的要塞。
本篇将针对Ocelot添加Metrics+InfluxDB+Grafana架构的监控。
1.下载安装InfluxDB和Grafana
在使用前需要先下载InfluxDB和Grafana这两个工具,下载安装方式大家可以先看下Edison Zhou大神的这篇:https://www.cnblogs.com/edisonchou/p/integrated_performance_monitoring_foundation.html,博主也是从这里学习的。
2.使用
安装好后,我们可以通过127.0.0.1:8083访问InfluxDB的可视化界面:
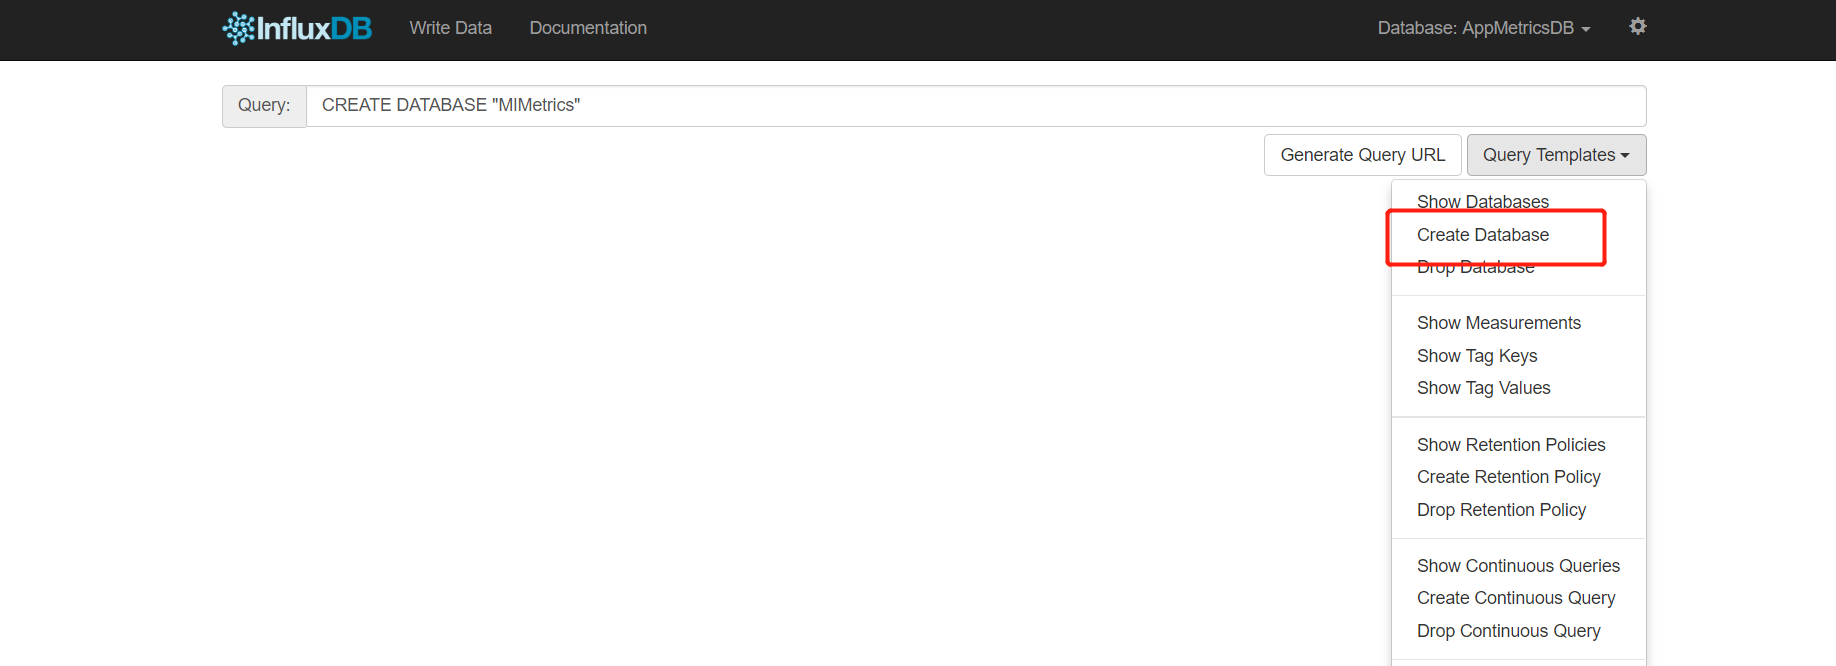
图中标出来的地方是InfluxDB提供给我们操作语句模板,通过Create Database创建一个名为“MIMetrics”的数据库,然后在右上角的设置按钮里我们可以设置用户名和密码,这里就不截图了,大家打开看一下就明白了。
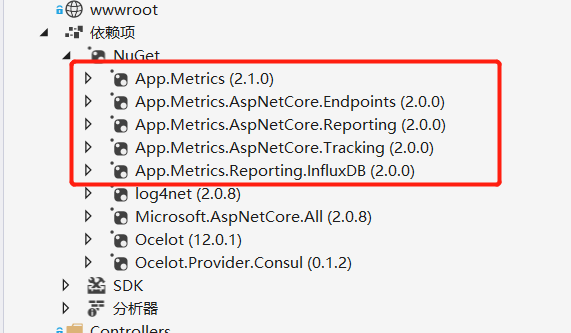
在我们的Ocelot项目中通过NuGet引用下面几个包:
扫描二维码关注公众号,回复:
3750731 查看本文章

然后需要在Startup.cs启动类中添加如下配置:
public void ConfigureServices(IServiceCollection services)
        {

            #region 注册Metrics
            bool isOpenMetrics = Convert.ToBoolean(Configuration["AppMetrics:IsOpen"]);
            if (isOpenMetrics)
            {
                string database = Configuration["AppMetrics:DatabaseName"];
                string connStr = Configuration["AppMetrics:ConnectionString"];
                string app = Configuration["AppMetrics:App"];
                string env = Configuration["AppMetrics:Env"];
                string username = Configuration["AppMetrics:UserName"];
                string password = Configuration["AppMetrics:Password"];

                var uri = new Uri(connStr);
                var metrics = AppMetrics.CreateDefaultBuilder().Configuration.Configure(options =>
                {
                    options.AddAppTag(app);
                    options.AddEnvTag(env);
                }).Report.ToInfluxDb(options =>
                {
                    options.InfluxDb.BaseUri = uri;
                    options.InfluxDb.Database = database;
                    options.InfluxDb.UserName = username;
                    options.InfluxDb.Password = password;
                    options.HttpPolicy.BackoffPeriod = TimeSpan.FromSeconds(30);
                    options.HttpPolicy.FailuresBeforeBackoff = 5;
                    options.HttpPolicy.Timeout = TimeSpan.FromSeconds(10);
                    options.FlushInterval = TimeSpan.FromSeconds(5);
                }).Build();

                services.AddMetrics(metrics);
                services.AddMetricsReportScheduler();
                services.AddMetricsTrackingMiddleware();
                services.AddMetricsEndpoints();
                services.AddMetricsTrackingMiddleware(options => options.IgnoredHttpStatusCodes = new[] { 404 });
            }
            #endregion

            services.AddOcelot(Configuration)
                .AddConsul();

            services.AddMvc(options =>
            {
                options.Filters.Add<HttpGlobalExceptionFilter>(); //加入全局异常类
            });
        }

        // This method gets called by the runtime. Use this method to configure the HTTP request pipeline.
        public void Configure(IApplicationBuilder app, IHostingEnvironment env, IApplicationLifetime lifetime, ILoggerFactory loggerFactory)
        {
            if (env.IsDevelopment())
            {
                app.UseDeveloperExceptionPage();
            }

            //loggerFactory.AddConsole(Configuration.GetSection("Logging"));
            bool isOpenMetrics = Convert.ToBoolean(Configuration["AppMetrics:IsOpen"]);
            if(isOpenMetrics)
            {
                app.UseMetricsAllMiddleware();
                app.UseMetricsAllEndpoints();
            }


            app.UseOcelot();

            app.UseMvc();
        }
蓝色部分的代码是我们这次需要的,通过注册Metrics中间件的形式使用InfluxDB,然后下面是配置文件中需要添加的:
{
  "Logging": {
    "IncludeScopes": false,
    "Debug": {
      "LogLevel": {
        "Default": "Warning"
      }
    },
    "Console": {
      "LogLevel": {
        "Default": "Warning"
      }
    }
  },
  "AppMetrics": {
    "IsOpen": true,
    "DatabaseName": "MIMetrics",
    "ConnectionString": "http://127.0.0.1:8086",
    "UserName": "admin",
    "Password": "tangjinghe",
    "App": "Ocelot",
    "Env": "Development"
  }
}
这样,配置就算完成了,然后重新运行起网关,发送几个请求后查看http://localhost:3000的Grafana的可视化界面:
