版权声明:本文为博主原创文章,未经博主允许不得转载。 https://blog.csdn.net/qq_39759115/article/details/80506194
两种自定义标记
在 echarts 中 markPoint 的样式内置了 ‘circle’, ‘rect’, ‘roundRect’, ‘triangle’, ‘diamond’, ‘pin’, ‘arrow’ 几种,如果这些都不太符合需要就必须自定义我们需要的样式。
自定义标记的图形有两种方式:
1. 通过 ‘image://url’ 设置为图片,其中 URL 为图片的链接,或者 dataURI。
2. 通过 ‘path://’ 将图标设置为任意的矢量路径。这种方式相比于使用图片的方式,不用担心因为缩放而产生锯齿或模糊,而且可以设置为任意颜色。路径图形会自适应调整为合适的大小。
svg 的 path
<path> 标签用来定义路径。 使用 path 标签时,就像用指令的方式来控制一只画笔,比如:移动画笔到某一坐标位置,画一条线,画一条曲线等等
下面的指令可用于路径数据:
- M = moveto(M X,Y) :将画笔移动到指定的坐标位置
- L = lineto(L X,Y) :画直线到指定的坐标位置
- H = horizontal lineto(H X):画水平线到指定的X坐标位置
- V = vertical lineto(V Y):画垂直线到指定的Y坐标位置
- C = curveto(C X1,Y1,X2,Y2,ENDX,ENDY):三次贝赛曲线
- S = smooth curveto(S X2,Y2,ENDX,ENDY)
- Q = quadratic Belzier curve(Q X,Y,ENDX,ENDY):二次贝赛曲线
- T = smooth quadratic Belzier curveto(T ENDX,ENDY):映射
- A = elliptical Arc(A RX,RY,XROTATION,FLAG1,FLAG2,X,Y):弧线
- Z = closepath():关闭路径
说明:
坐标轴为以(0,0)为中心,X轴水平向右,Y轴水平向下。
所有指令大小写均可。大写绝对定位,参照全局坐标系;小写相对定位,参照父容器坐标系
指令和数据间的空格可以省略
同一指令出现多次可以只用一个
比如绘制一个三角形:
<?xml version="1.0" standalone="no"?>
<!DOCTYPE svg PUBLIC "-//W3C//DTD SVG 1.1//EN"
"http://www.w3.org/Graphics/SVG/1.1/DTD/svg11.dtd">

<svg width="100%" height="100%" version="1.1" xmlns="http://www.w3.org/2000/svg">
    <path d="M250 150 L150 350 L350 350 Z" />
</svg>详细说明可参考:svg中path标签的用法
或者 w3c: SVG -path
echarts 的 path://
在 echarts 上使用 path 只需把 path 标签上的指令写在 path:// 之后:
symbol: 'path://M250 150 L150 350 L350 350 Z', 一个绘制文本提示框的小例子:
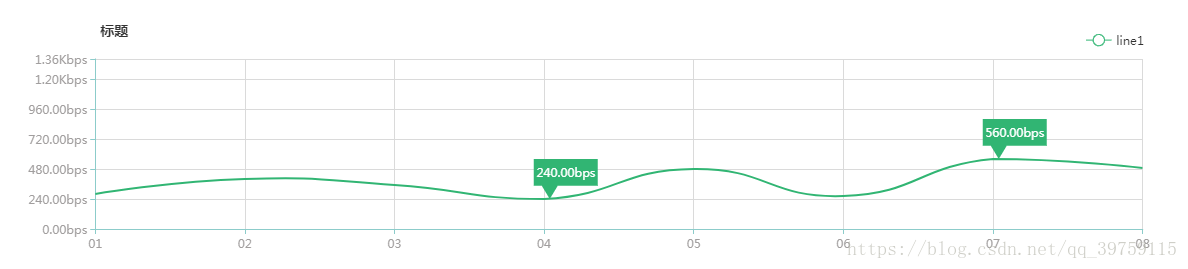
代码:
        var myChart = echarts.init(document.getElementById(id));
        var option = {
            title: {
                text: "标题",
                top: 20,
                left: '10%',
                textStyle:{
                    fontSize: 14,
                    fontWeight: 600
                }
            },
            legend: {
                data: ["line1"],
                top: 30,
                right: "6.5%",
                formatter: function (name) {
                    return  name;
                },
                itemGap: 40
            },
            grid:{
                top: 60,
                left: "10%",
                right: "7%",
                bottom: 40
            },
            tooltip: {
                trigger: 'axis',
                formatter: function (data){
                    var html = '';
                    if(data.componentType == 'markPoint'){
                        html = data.seriesName;
                    }else{
                        html = data[0].name;
                        for(var i=0; i<data.length; i++){
                            var now = data[i];
                            html += '</br><span style="display:inline-block;margin-right:5px;border-radius:10px;width:9px;height:9px;background-color:'+now.color+'"></span>' + now.seriesName + ': ' + toHSpeed(now.data, 2);
                        }
                    }
                    return html
                }
            },
            xAxis: [
                {
                    type : 'category',
                    boundaryGap: false,
                    axisTick: {
                        alignWithLabel: false,
                        interval: 0
                    },
                    axisLine:{
                        lineStyle:{
                            color:'#8cccca'
                        }
                    },
                    axisLabel: {
                        textStyle: {
                            color: '#a19e9e'
                        },
                        interval:0,
                        formatter: function (value, index) {
                            return value;
                        }
                    },
                    splitLine:{
                        show: true,
                        lineStyle:{
                            color:'#dadada'
                        }
                    },
                    data:["01","02","03","04","05","06","07","08"]
                }
            ],
            yAxis: [
                {
                    type : 'value',
                    axisLine:{ // y 线样式修改
                        lineStyle:{
                            color:'#8cccca'
                        }
                    },
                    axisLabel: { // y 名称样式修改
                        textStyle: {
                            color: '#a19e9e'
                        },
                        formatter: function (data){
                            return toHSpeed(data, 2);
                        }
                    },
                    splitLine:{ // 取消y轴的网格
                        show: true,
                        lineStyle:{
                            color:'#dadada'
                        }
                    },
                    min: 0,
                    max:function(value) {
                        return value.max + 100;
                    }
                }
            ],
            series: [
                {
                    name: "line1" ,
                    type: 'line',
                    color: ['#31b573'],// 颜色
                    showSymbol: false,
                    silent: true, // 取消点击事件
//                    areaStyle:{ // 填充颜色
//                        normal:{
//                            opacity: 0.1
//                        }
//                    },
                    smooth:true,
                    itemStyle:{ // 转折点 控制
                        normal:{
                            borderColor:'#277cdc'
                        }
                    },
                    data: [35,50,44,30,60,33,70,61],
                    markPoint: {
                        symbol: 'path://m 0,0 h 48 v 20 h -30 l -6,10 l -6,-10 h -6 z', // 'circle', 'rect', 'roundRect', 'triangle', 'diamond', 'pin', 'arrow', path://m 0,0 h 48 v 20 h -30 l -6,10 l -6,-10 h -6 z,  path://m 0,0 h 48 v 20 h -34 l -6,10 l -6,-10 h -2 z
                        symbolSize: function(val){
                            return [textSize(toHSpeed(val, 2),"12px").width+5,40]
                        },
                        symbolOffset: ['34%', '-50%'],
                        symbolKeepAspect: true,// 如果 symbol 是 path:// 的形式,是否在缩放时保持该图形的长宽比。
                        label:{
                            position: "insideTop",
                            distance: 7,
                            formatter: function (data){
                                return toHSpeed(data.value, 2);
                            }
                        },
                        data: [
                            {type: 'max', name: '最大值'},
                            {type: 'min', name: '最小值'}
                        ]
                    }
                }
            ]
        };
        myChart.setOption(option,true);
        window.addEventListener("resize", function () {
            myChart.resize();
        });


    /**
     * 获取文本宽高
     * @param text       文本
     * @param fontSize   代表汉字的大小,英文字会自动按照默认值
     * @returns {{width: *, height: *}}
     */
    function textSize(text,fontSize) {
        var span = document.createElement("span");
        var result = {
            "width": span.offsetWidth,
            "height": span.offsetHeight
        };
        span.style.visibility = "hidden";
        span.style.fontSize = fontSize || "14px";
        document.body.appendChild(span);

        if (typeof span.textContent != "undefined")
            span.textContent = text || "国";
        else span.innerText = text || "国";

        result.width = span.offsetWidth - result.width;
        result.height = span.offsetHeight - result.height;
        span.parentNode.removeChild(span);
        return result;
    }

   function toHSpeed(speed,fix) {
        if(isNaN(speed))
            return speed;
        if(!fix&&fix!=0)
            fix=2;
        if(speed>=125000000)
        {
            speed/=125000000;
            speed=speed.toFixed(fix)+"Gbps"
        }
        else if(speed>=125000)
        {
            speed/=125000;
            speed=speed.toFixed(fix)+"Mbps"
        }
        else if(speed>=125)
        {
            speed/=125;
            speed=speed.toFixed(fix)+"Kbps"
        }
        else
        {
            speed*=8;
            speed=speed.toFixed(fix)+"bps"
        }
        return speed
    }