版权声明:本文为博主原创文章,未经博主允许不得转载。 https://blog.csdn.net/zly412934578/article/details/82987569
#_author:"zhengly"
#date:2018/8/30
'''
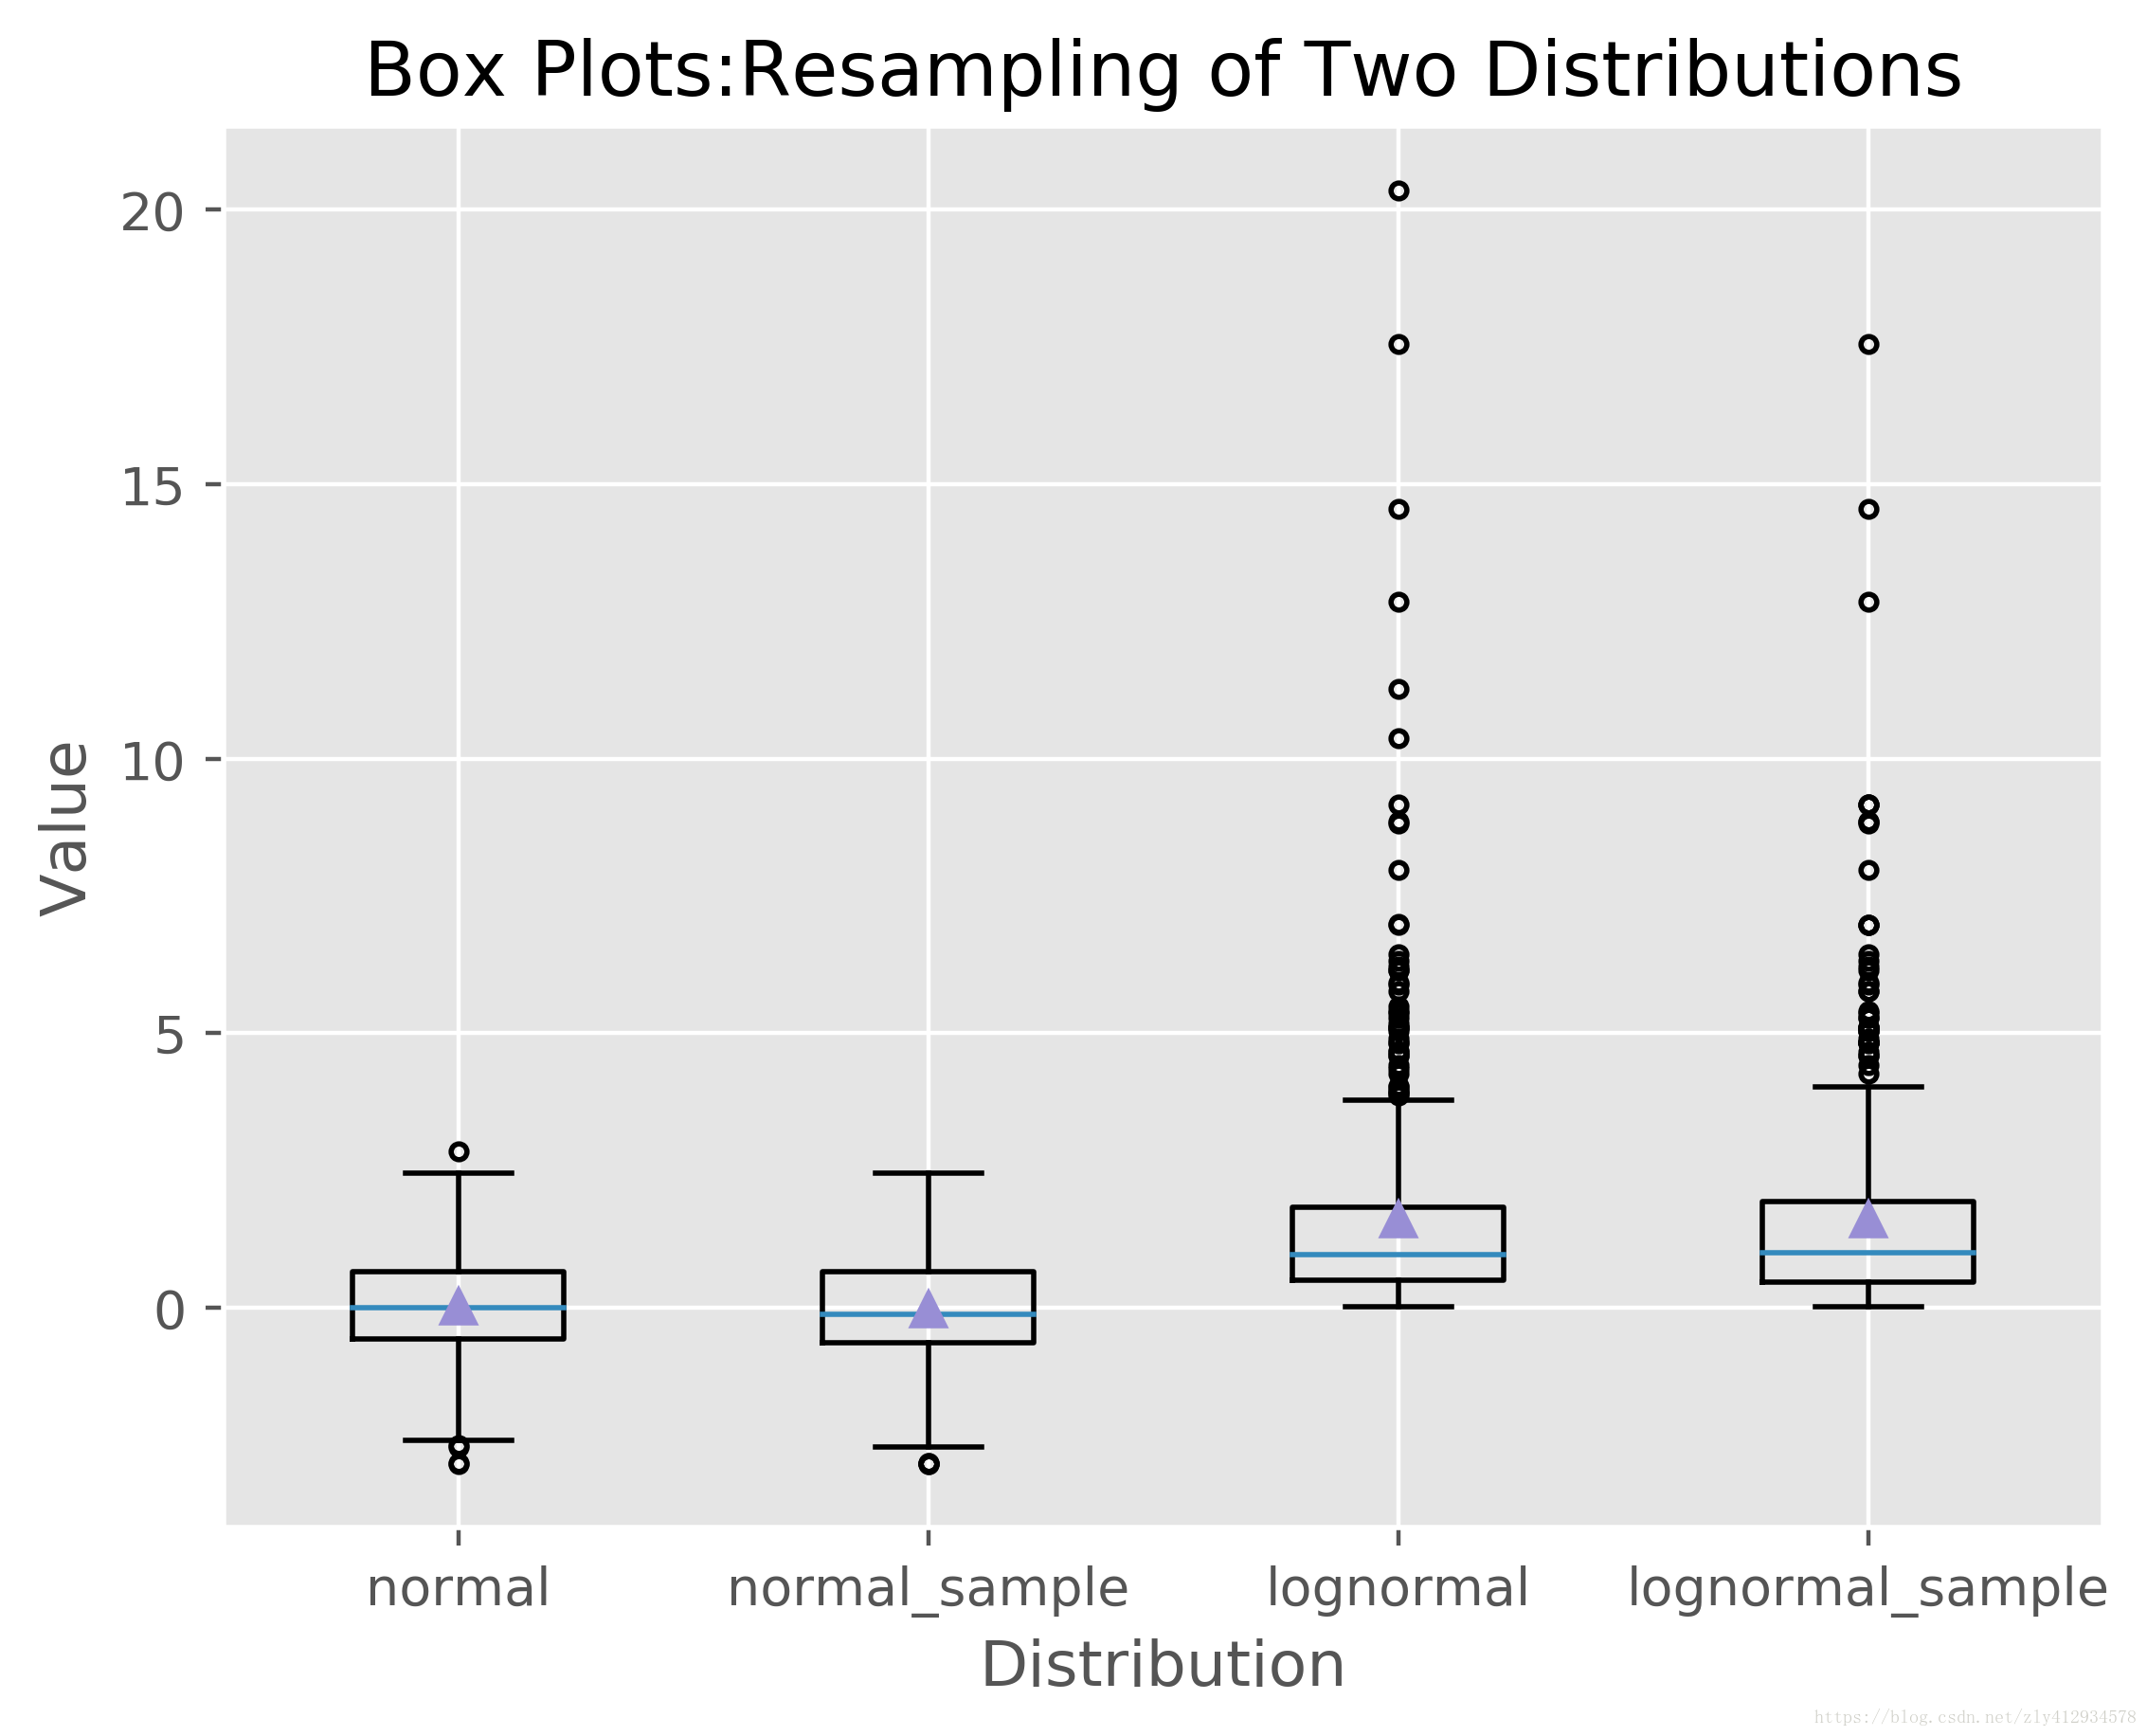
箱线图
'''
import numpy as np
import matplotlib.pyplot as plt
plt.style.use('ggplot')
N = 500
normal = np.random.normal(loc=0.0,scale=1.0,size=N)
lognormal = np.random.lognormal(mean=0.0,sigma=1.0,size=N)
index_value = np.random.random_integers(low=0,high=N-1,size=N)
normal_sample = normal[index_value]
lognormal_sample = lognormal[index_value]
box_plot_data = [normal,normal_sample,lognormal,lognormal_sample]
fig = plt.figure()
ax1 = fig.add_subplot(1,1,1)
#每个箱线的标签
box_label = ['normal','normal_sample','lognormal','lognormal_sample']
#box_plot创建4个箱线图,notch=False表示箱体是矩形,而不是中间收缩
#sym='.'表示离群点使用圆点,而不是默认的+号
#vert=True表示箱体是垂直的,不是水平的
#whis=1.5设定了指直线从第一四分位数和第三四分位数延伸出的范围
#showmeans=True表示箱体在显示中位数的同时也显示均值
#lables=box_lable表示使用box_lable中的值来标记箱线图
ax1.boxplot(box_plot_data,notch=False,sym='.',vert=True,whis=1.5,showmeans=True,labels=box_label)
ax1.xaxis.set_ticks_position('bottom')
ax1.yaxis.set_ticks_position('left')
ax1.set_title('Box Plots:Resampling of Two Distributions')
ax1.set_xlabel('Distribution')
ax1.set_ylabel('Value')
plt.savefig('box_plot.png',dpi=400,bbox_inches='tight')
plt.show()