目录:
1:为什么选择pyecharts和talib
2:效果展示
3:开发过程及技巧
1:为什么选择echarts和talib
众所周知,python中最基础、常用的作图工具库是matplotlib,但由于其支持图形较少、色彩搭配不好、功能集成度低等缺点,在对期货数据进行可视化时我选择了pyecharts,这个图表库功能比较契合项目需要且做出来的图美观大方,最重要的是使用起来很简单,说明文档非常详尽,阅读片刻便可以上手完成工作需要。另外,talib在前面几篇博客中有介绍,这里就不多说,总之,在较好完成项目需要的前提下,本人选择解决方法的原则是“简单”,“高效”,“漂亮”。这里附pyecharts的文档链接:
2:效果展示
通过pyecharts得到的可视化结果是用浏览器查看的,最好使用谷歌浏览器或火狐,响应较快。
完成整个程序用了三天时间,主要还是在多图并行展示还有性能调优方面花费时间较多,主要功能实现大概一天左右就可以了。效果图如下:
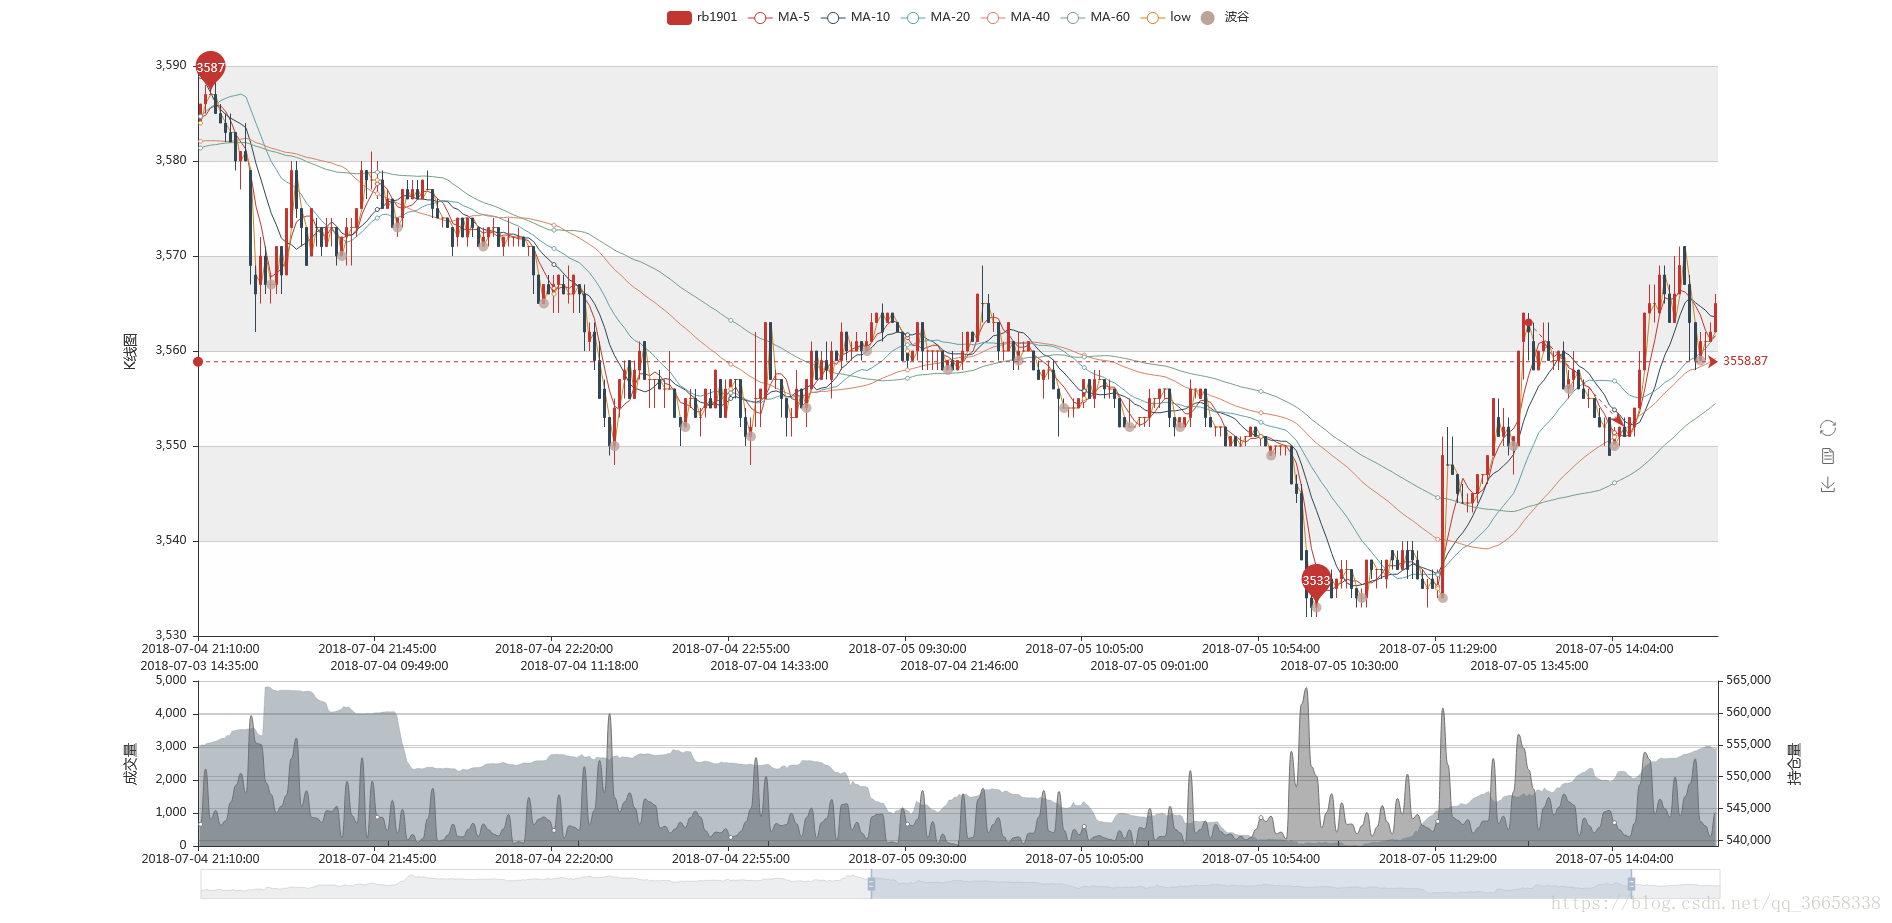
上图上半部分为某合约的K线图,其中包含蜡烛图、平均移动周期值(5.10.20.40.60)、全局均线、波峰波谷点、支撑线和压力线。
下半部分是两个图的叠加,分别是成交量和持仓量的面积图。最下方有个滑块可以对区间进行选择,支持鼠标拖动及缩放。
3:开发过程及技巧
虽然大部分功能通过阅读文档快速上手,不过在添加一些自己需要的元素进去的时候需要一些小技巧。下面直接针对其中可能用到的功能做出解释:
(1)移动平均周期值计算
(2)趋势线的计算
趋势线是K线图中常用的基础指标之一,大概思路为:将收盘价放入list中-->拟合为一根曲线-->求得所有波峰波谷-->判断波峰波谷所在位置是阴线还是阳线-->求升高(下降)的三个波峰(波谷)-->连接首尾两个极值点。大概过程就是如此,下面贴上主要步骤的代码:
波峰波谷计算函数
#encoding=utf-8
#波峰波谷计算函数
from __future__ import division, print_function
import numpy as np


def detect_peaks(x, mph=None, mpd=1, threshold=0, edge='rising',
                 kpsh=False, valley=False, show=False, ax=None):
    """
    波峰波谷计算函数
    vally:波峰or波谷
    show:是否显示
    ax:坐标轴长度
    """

    x = np.atleast_1d(x).astype('float64')
    if x.size < 3:
        return np.array([], dtype=int)
    if valley:
        x = -x
    # 找到波峰索引
    dx = x[1:] - x[:-1]
    # 处理异常值
    indnan = np.where(np.isnan(x))[0]
    if indnan.size:
        x[indnan] = np.inf
        dx[np.where(np.isnan(dx))[0]] = np.inf
    ine, ire, ife = np.array([[], [], []], dtype=int)
    if not edge:
        ine = np.where((np.hstack((dx, 0)) < 0) & (np.hstack((0, dx)) > 0))[0]
    else:
        if edge.lower() in ['rising', 'both']:
            ire = np.where((np.hstack((dx, 0)) <= 0) & (np.hstack((0, dx)) > 0))[0]
        if edge.lower() in ['falling', 'both']:
            ife = np.where((np.hstack((dx, 0)) < 0) & (np.hstack((0, dx)) >= 0))[0]
    ind = np.unique(np.hstack((ine, ire, ife)))
    # 处理异常值
    if ind.size and indnan.size:

        ind = ind[np.in1d(ind, np.unique(np.hstack((indnan, indnan - 1, indnan + 1))), invert=True)]

    if ind.size and ind[0] == 0:
        ind = ind[1:]
    if ind.size and ind[-1] == x.size - 1:
        ind = ind[:-1]
    # 设置最小波峰高
    if ind.size and mph is not None:
        ind = ind[x[ind] >= mph]
    # 设置邻居数目
    if ind.size and threshold > 0:
        dx = np.min(np.vstack([x[ind] - x[ind - 1], x[ind] - x[ind + 1]]), axis=0)
        ind = np.delete(ind, np.where(dx < threshold)[0])
    # 找到区域内所有波峰
    if ind.size and mpd > 1:
        ind = ind[np.argsort(x[ind])][::-1]  # 排序
        idel = np.zeros(ind.size, dtype=bool)
        for i in range(ind.size):
            if not idel[i]:

                idel = idel | (ind >= ind[i] - mpd) & (ind <= ind[i] + mpd) \
                       & (x[ind[i]] > x[ind] if kpsh else True)
                idel[i] = 0  # Keep current peak

        ind = np.sort(ind[~idel])

    if show:
        if indnan.size:
            x[indnan] = np.nan
        if valley:
            x = -x
        _plot(x, mph, mpd, threshold, edge, valley, ax, ind)

    return ind
趋势线计算函数
#encoding=utf-8
from detect_peaks import *
"""
该文件包含三个功能:
1:调用detect_peaks计算波峰波谷;
2:计算趋势线(包括压力线和支撑线);
3:将趋势线所找到的线段长度扩增至二倍;
input:开盘价列表(openList=【】)
output:趋势线首尾两个坐标suprootLine=【【x1,y1】,【x2,y2】】
"""
def cal_trendLine(openList,closeList):
    topLine=[]                      #开盘价和收盘价中的相对高点
    lowLine=[]                      #开盘价和收盘价中的相对低点
    topPoint=[]                     #波峰列表
    lowPoint=[]                     #波谷列表
    kList=[0]                       #斜率列表
    bList=[]                        #方程参数列表
    supportLine=[[],[]]            #支撑线的首尾坐标点
    pressLine=[[],[]]               #压力线的首尾坐标列表
   #计算波峰波谷
    wixh = detect_peaks(openList, mpd=8, show=False)
    wixl=detect_peaks(openList, mpd=8, valley=True, show=False)

    #将开盘价和收盘价比较得到较高点和较低点
    for point1, point2 in zip(openList, closeList):
        if point1 > point2:
            topLine.append(int(point1))
            lowLine.append(int(point2))
        elif point1 <= point2:
            topLine.append(int(point2))
            lowLine.append(int(point1))

    #将结果表示为【数字索引,值】以计算斜率
    for num in wixh:
        eachLine=[]
        eachLine.append(num)
        eachLine.append(topLine[num])
        topPoint.append(eachLine)
    for num in wixl:
        eachLine=[]
        eachLine.append(num)
        eachLine.append(lowLine[num])
        lowPoint.append(eachLine)

    """
    计算支撑线:1:计算两两相邻波谷的斜率,求出直线方程;
             2:遍历剩余所有点,找到经过该直线的点;
             3:输出第一个点与最后一个点,则其支撑线为两点连线
    """
    for num in range(1,len(lowPoint)):
        k=round((lowPoint[num][1]-lowPoint[num-1][1]),1)/round((lowPoint[num][0]-lowPoint[num-1][0]),1)
        kList.append(round(k,2))

    for point,k in zip(lowPoint,kList):
        b=point[1]-k*point[0]
        bList.append(b)
    bList.pop(0)
    kList.pop(0)

    for num1 in range(0,len(kList)):
        num2=num1+2

        if num2<len(lowPoint):

            if lowPoint[num2][1]==kList[num1]*lowPoint[num2][0]+bList[num1]:
                supportLine[0]=(lowPoint[num1])
                supportLine[1]=(lowPoint[num2])
        else:
            break
    """
       计算压力线:1:计算两两相邻波峰的斜率,求出直线方程;
                2:遍历剩余所有点,找到经过该直线的点;
                3:输出第一个点与最后一个点,则其压力线为两点连线
    """
    for num in range(1, len(topPoint)):
        k = round((topPoint[num][1] - topPoint[num - 1][1]), 1) / round((topPoint[num][0] - topPoint[num - 1][0]), 1)
        kList.append(round(k, 2))

    for point, k in zip(topPoint, kList):
        b = point[1] - k * point[0]
        bList.append(b)
    bList.pop(0)
    kList.pop(0)

    for num1 in range(0, len(kList)):
        num2=num1+2
        if num2 < len(topPoint):
            if topPoint[num2][1] == kList[num1] * topPoint[num2][0] + bList[num1]:
                pressLine[0] = (topPoint[num1])
                pressLine[1] = (topPoint[num2])
        else:
            break
    return pressLine,supportLine
(3)多图叠加展示
这个功能允许在固定区域叠加展示多张图,使得尽可能多的为使用者提供更多信息。使用的主要函数是overlap()代码很简单,但想调试出最佳效果需要自己对尺寸和位置进行设置。
(3)多图并行展示
多图并行展示在适用范围上更大于叠加展示,在本例的html页面中同时将K线图及成交量/持仓量使用该功能实现,具体使用见文档。
以上内容,不免纰漏,欢迎指正。