import matplotlib.pyplot as plt
import numpy as np
import requests

url='https://api.github.com/search/repositories?q=language:python&sort=stars'
r=requests.get(url)
print('数据访问状态值:',r.status_code)
print('成功,正常获取网站数据'if r.status_code==200 else '错误,无法获取数据')

response_dict=r.json()  #转换成字典
#print(response_dict)
repo_dicts=response_dict['items']
#print(repo_dicts)
names=[repo_dict['name']for repo_dict in repo_dicts]
print(names)
plot_dicts=[repo_dict['stargazers_count'] for repo_dict in repo_dicts]
print(plot_dicts)

x=np.arange(len(names)) #x轴
plt.bar(x,plot_dicts)   #y轴
plt.plot(x,plot_dicts,'rp--') #折线图

ax=plt.subplot()
ax.set_ylabel('stargazers_count') #y轴标题
ax.set_xlabel('Github Reponstorys')  #x轴标题

ax.set_xticks(x)  #设置每一个x的标题
ax.set_xticklabels(names,rotation=90) #给每一个柱子加上标题
ax.set_title('Github')


#plt.grid(linestyle='--')  #虚线为背景,一个’-‘为实线,俩个为虚线
#plt.show()
#保存图片
import os
imgPath = os.getcwd() + '/images/ch04_demo05_github.jpg'
plt.savefig(imgPath)
print('图片保存成功.')
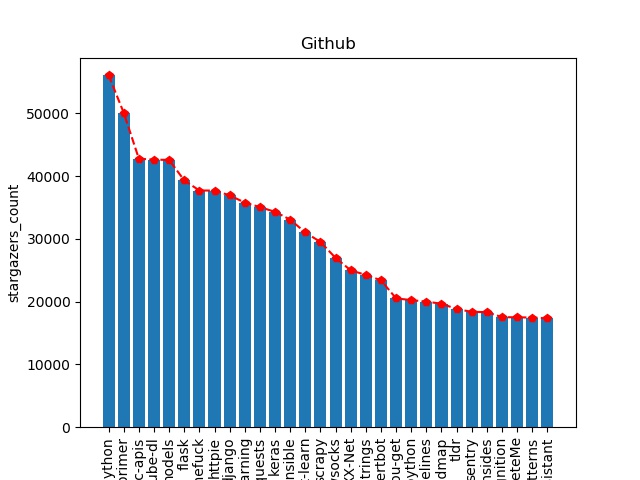
结果为:

这个其实比较简单,就是将json数据拿出来,并用matplotlib可视化一下就ok了