版权声明:本文为博主原创文章,未经博主允许不得转载。 https://blog.csdn.net/qq_31390999/article/details/82828898
import numpy as np
import matplotlib.pyplot as plt
labels ='A','B','C','D'
fraces = [15,30,45,10]
plt.pie(x=fraces,labels= labels)
plt.show()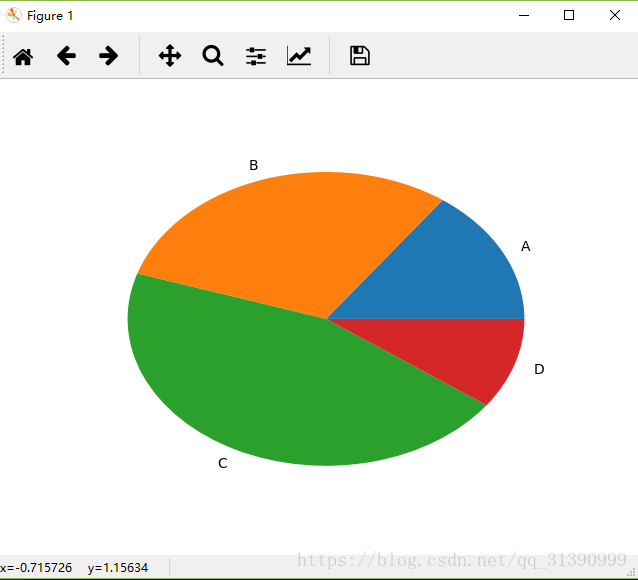
椭圆变标准圆 plt.axes(aspect=1)
import numpy as np
import matplotlib.pyplot as plt
labels ='A','B','C','D'
fraces = [15,30,45,10]
plt.axes(aspect=1)
plt.pie(x=fraces,labels= labels)
plt.show()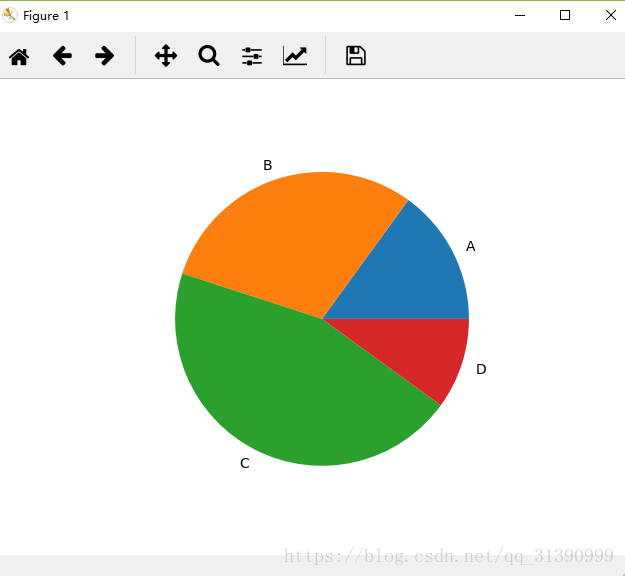
在图上显示所占份额autopct='%0f%%'
import numpy as np
import matplotlib.pyplot as plt
labels ='A','B','C','D'
fraces = [15,30,45,10]
plt.axes(aspect=1)
plt.pie(x=fraces,labels= labels,autopct='%0f%%')
plt.show()
突出重点,分离某一块explode= explode
import numpy as np
import matplotlib.pyplot as plt
labels ='A','B','C','D'
fraces = [15,30,45,10]
explode = [0,0.5,0,0]
plt.axes(aspect=1)
plt.pie(x=fraces,labels= labels,autopct='%0f%%',explode= explode)
plt.show()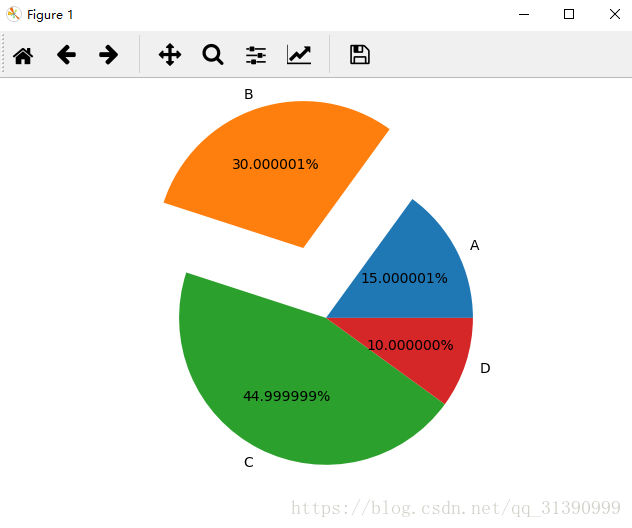
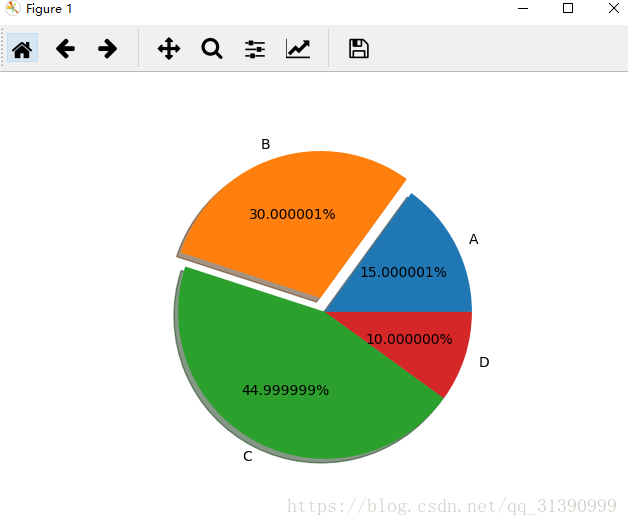
实现立体感 有阴影 shadow=True
import numpy as np
import matplotlib.pyplot as plt
labels ='A','B','C','D'
fraces = [15,30,45,10]
explode = [0,0.1,0,0]
plt.axes(aspect=1)
plt.pie(x=fraces,labels= labels,autopct='%0f%%',explode= explode,shadow=True)
plt.show()