前言:
承接上文k8s(五)、微服务框架istio流量策略控制
,测试环境需保留上文中的环境,在本文将重点展示istio微服务调用链关系展示,以及微服务工作状态监测,涉及组件有:
prometheus \ grafana \ jaeger等
非常感谢文章作者这几天耐心地解答疑惑:
http://www.maogx.win/posts/26/
微服务调用链追踪
安装jaeger
# 下载yml文件
mkdir jaeger && cd jaeger
wget https://raw.githubusercontent.com/jaegertracing/jaeger-kubernetes/master/all-in-one/jaeger-all-in-one-template.yml

# 实验环境不支持 LoadBalancer
# 可以修改jaeger-all-in-one-template.yml使用nodeport
# 也可以不修改,这样的会使用随机的nodeport

# 启动
kubectl apply -n istio-system -f jaeger-all-in-one-template.yml

# 查看
kubectl get pods -n istio-system
kubectl get svc -n istio-system

# 多次访问之前的vue react界面并点击发射按钮

# 访问
jaegerNodePort=$(kubectl get svc -n istio-system | grep jaeger-query | awk '{print $5}' | cut -d '/' -f 1 | cut -d ':' -f 2)
nodeName=$(kubectl get no | grep '<none>' | head -1 | awk '{print $1}')
nodeIP=$(ping -c 1 $nodeName | grep PING | awk '{print $3}' | tr -d '()')
echo "http://$nodeIP:"$jaegerNodePort

# 浏览器访问http://$nodeIP:"$jaegerNodePort
# 选择 istio-ingress 可以方便查看整个调用链

# 清理
cd jaeger
kubectl delete -n istio-system -f jaeger-all-in-one-template.yml
结果展示:
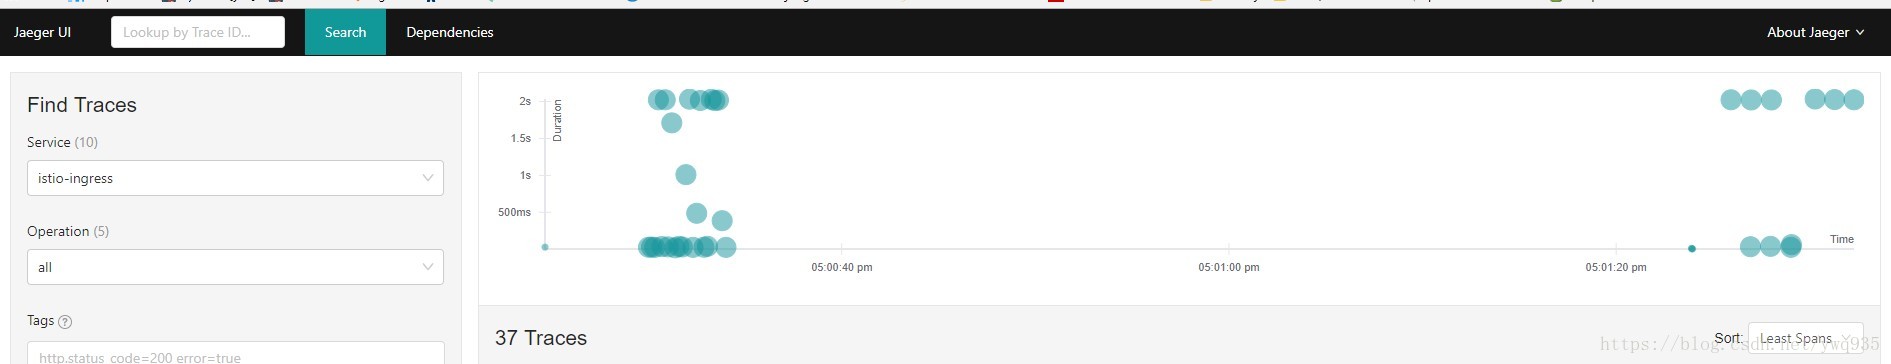
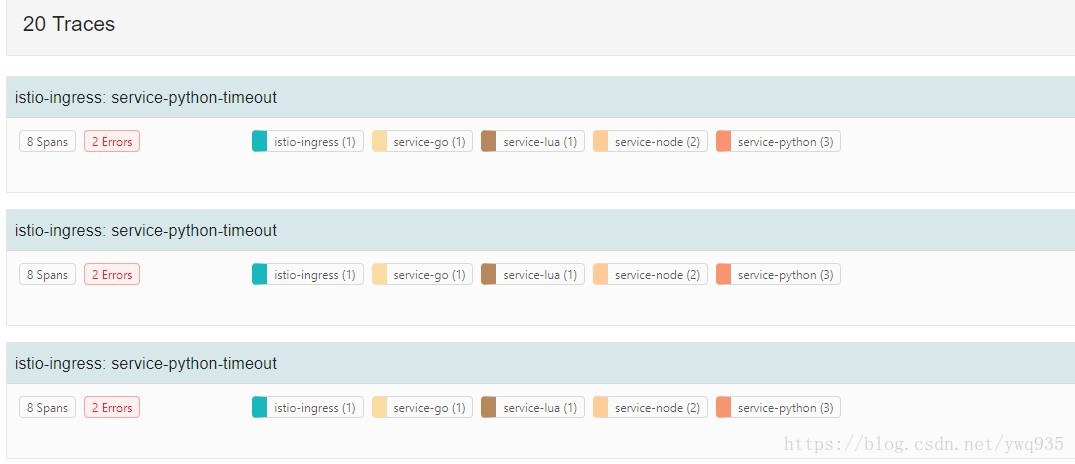
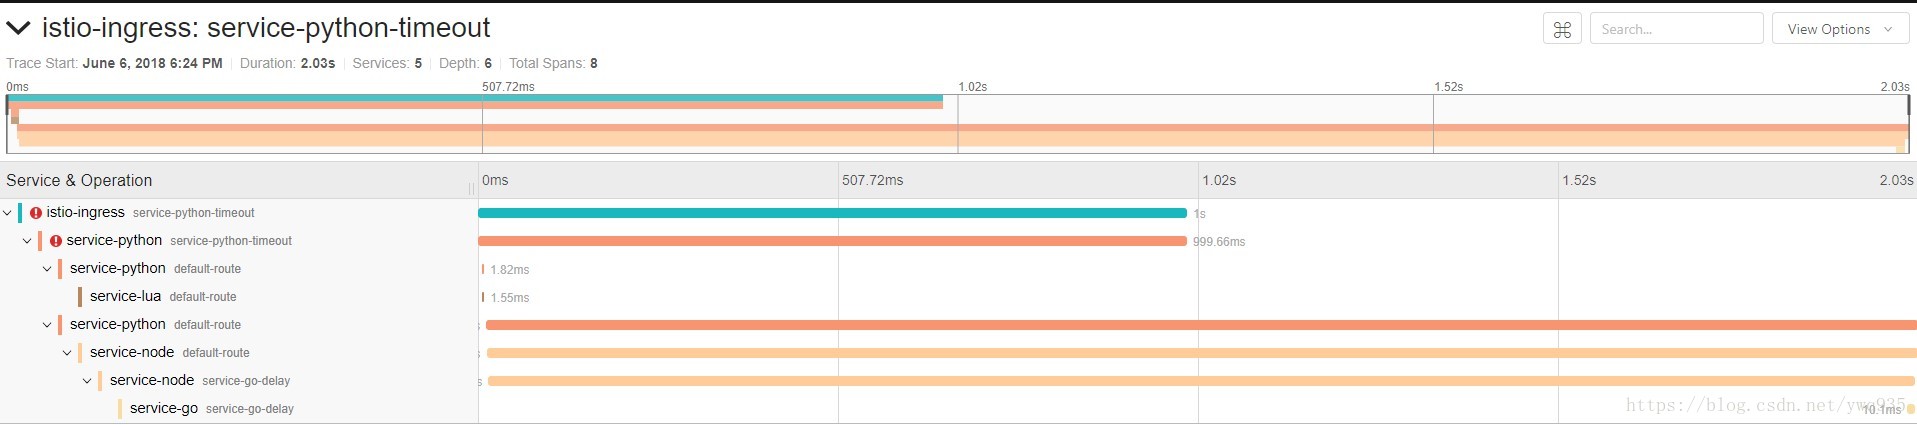
在主页可以查看每次调用trace到的svc间的交互细节明细分析,包括每一跳svc的耗时等。
监控指标收集:
# 安装prometheus
cd /usr/local/istio

# 修改支持nodeport
cp install/kubernetes/addons/prometheus.yaml install/kubernetes/addons/prometheus.yaml.ori
vim install/kubernetes/addons/prometheus.yaml
...
apiVersion: v1
kind: Service
metadata:
  annotations:
    prometheus.io/scrape: 'true'
  labels:
    name: prometheus
  name: prometheus
  namespace: istio-system
spec:
  selector:
    app: prometheus
  ports:
  - name: prometheus
    protocol: TCP
    port: 9090
  # 设置使用 nodeport
  type: NodePort
...

# 部署
kubectl apply -f install/kubernetes/addons/prometheus.yaml

## 配置收集
  #cd /root/istio-test:
istioctl create -f istio/new_telemetry.yml  #日志信息
istioctl create -f istio/tcp_telemetry.yml  #tcp信息收集

  #cd /usr/local/istio:
kubectl apply -f install/kubernetes/addons/grafana.yaml  #grafana可视化监控部署
kubectl apply -f install/kubernetes/addons/servicegraph.yaml   #服务树展示部署
访问测试,提供数据:
# 访问web测试
FORTIO_POD=$(kubectl get pod | grep fortio | awk '{ print $1 }')
kubectl exec -it $FORTIO_POD  -c fortio /usr/local/bin/fortio -- load -curl http://service-python/env

# 加大压力测试
kubectl exec -it $FORTIO_POD  -c fortio /usr/local/bin/fortio -- load -qps 20 -t 100s -loglevel Warning http://service-python/env
kubectl exec -it $FORTIO_POD  -c fortio /usr/local/bin/fortio -- load -qps 50 -t 100s -loglevel Warning http://service-go/env
查看效果:
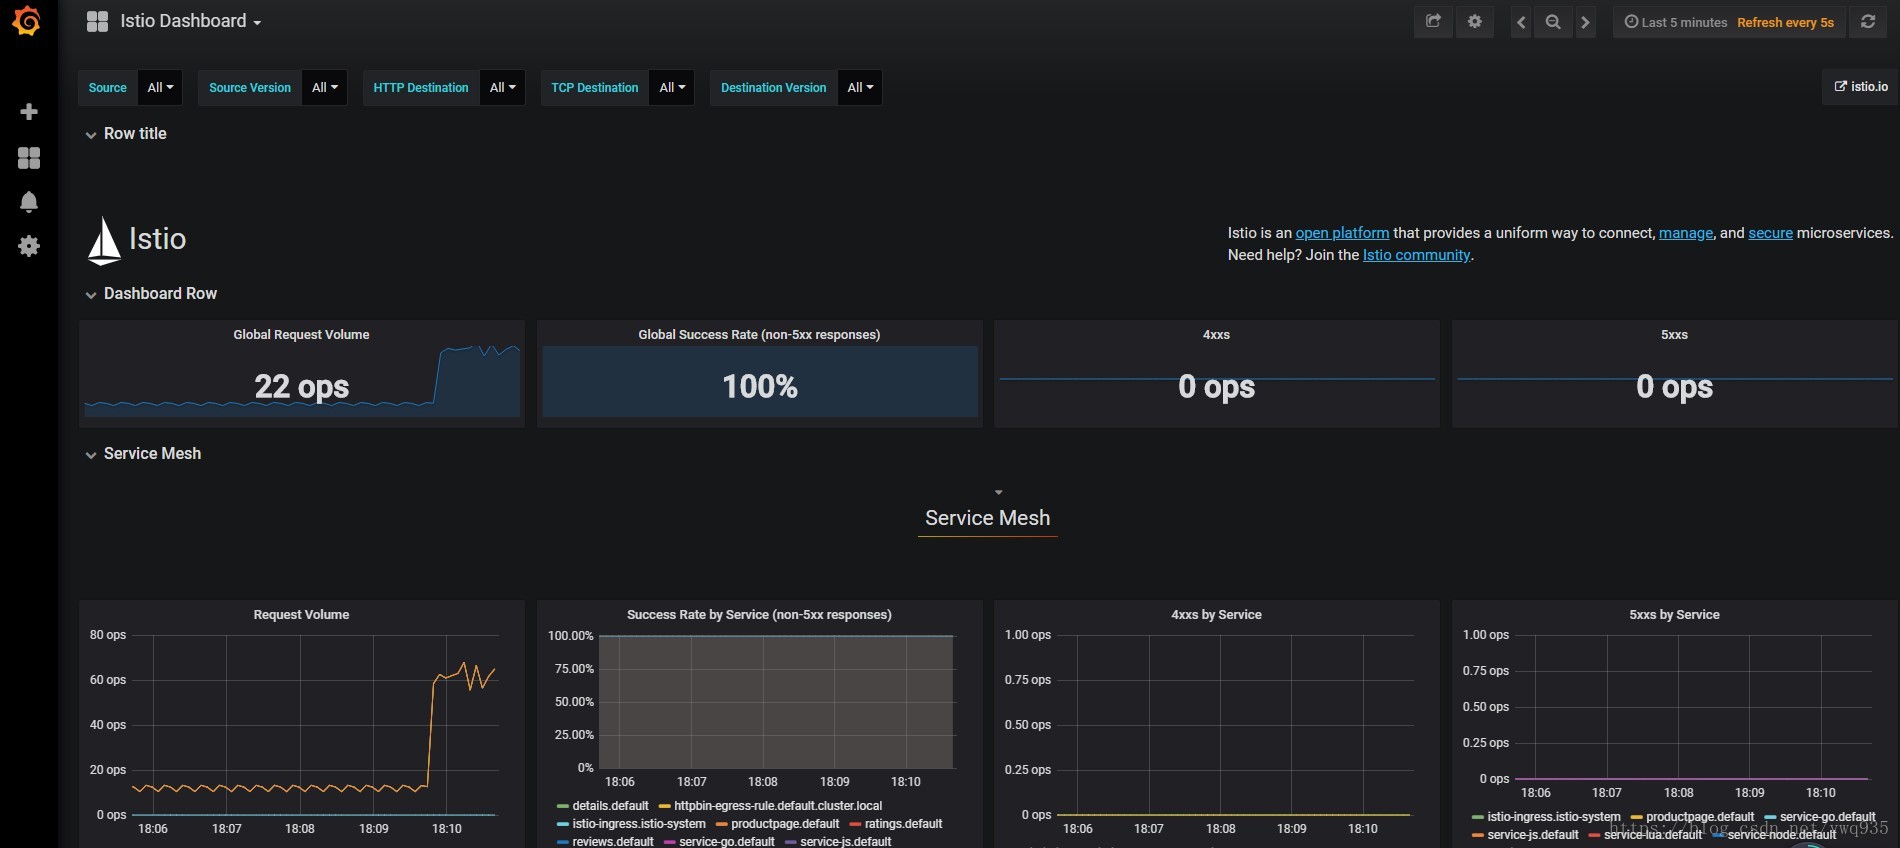
grafana:
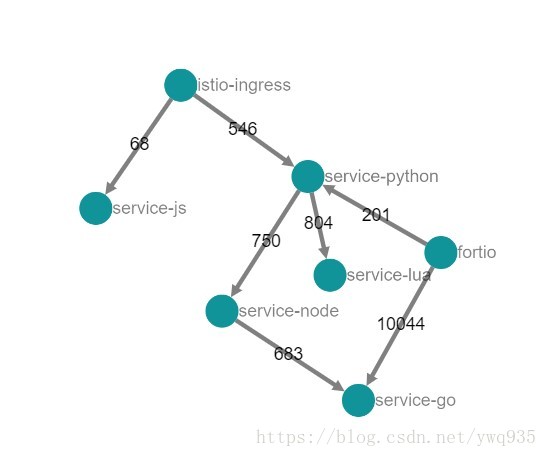
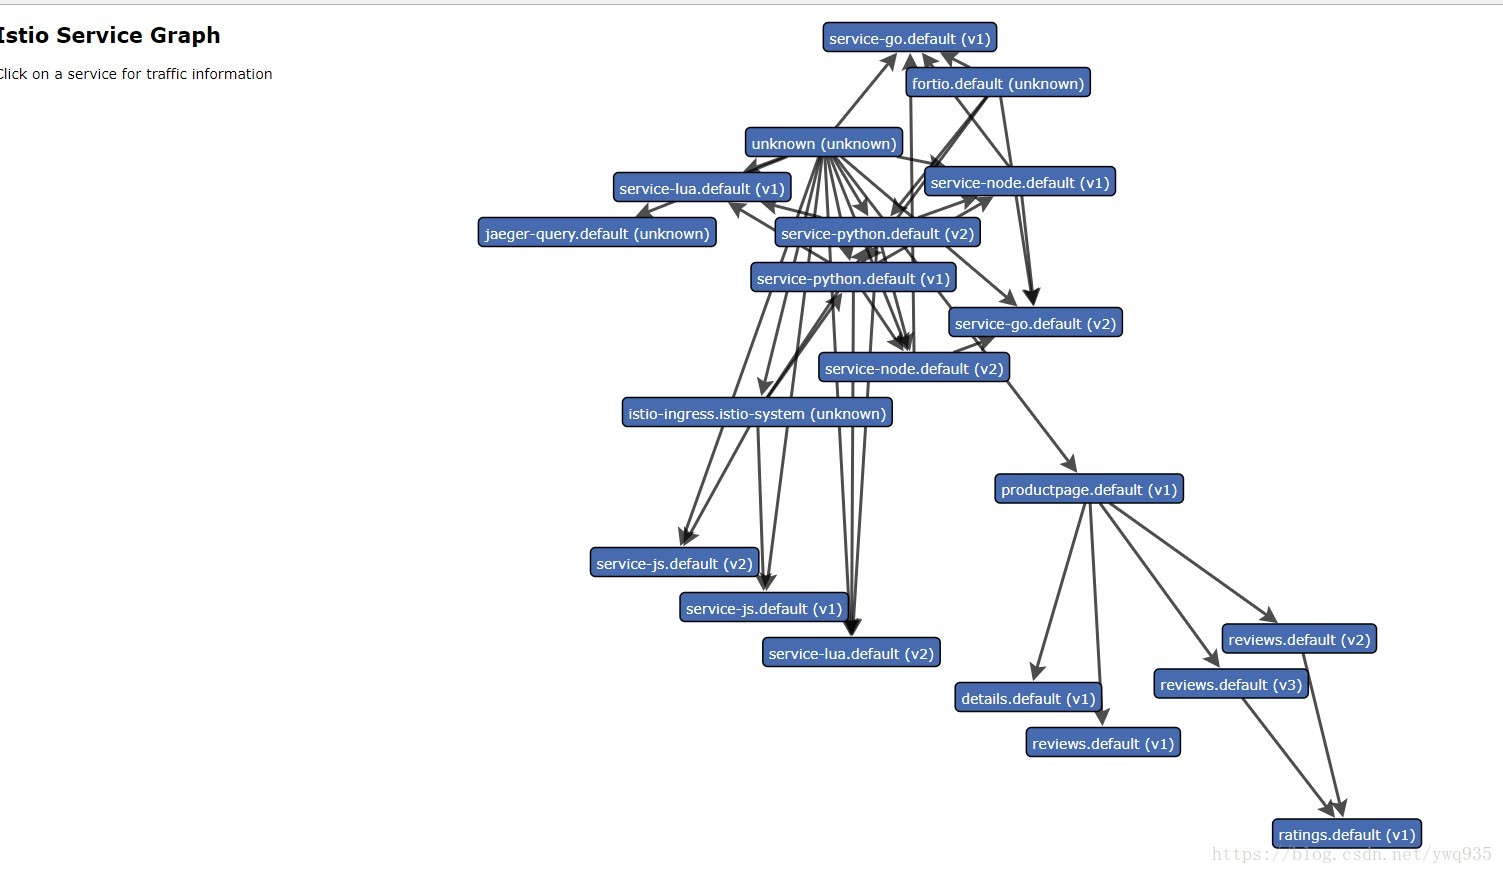
serviceTree:
故障注入,模拟服务故障
像上一节一样,将50%的包注入504故障:
#注入故障
istioctl create -f istio/route-rule-python-timeout.yml
istioctl create -f istio/route-rule-go-delay.yml

#再次压测
kubectl exec -it $FORTIO_POD  -c fortio /usr/local/bin/fortio -- load -qps 50 -n 200 -loglevel Warning http://service-python/env
# 前端同时多次点击‘发射’
查看效果
grafana:

jaeger:
说明:
1.在grafana右下角的趋势图中可以看到service-python出现了大量5xx代码
2.在jaeger的主页可以看到有Error的追踪,点击一个进去可以查看追踪明细(图2),可以看到在service-python段捕获到了Error code的包,其余调用链段均正常。
利用以上调用链分析工具及监控图表,可以快速识别微服务整个调用链中某一跳或者局部故障,便于分布式微服务架构的故障排查,同时监控图标中也有针对服务每一跳处理时间的分析,可以帮助开发人员进行针对性优化。
注意事项
写在最后,要实现服务链调用关系展示,还是得对代码进行微改,并不能百分百无入侵代码。要求在调用集群内svc的http api接口时,给http请求头部添加一些字段,
官网样例截图(python):
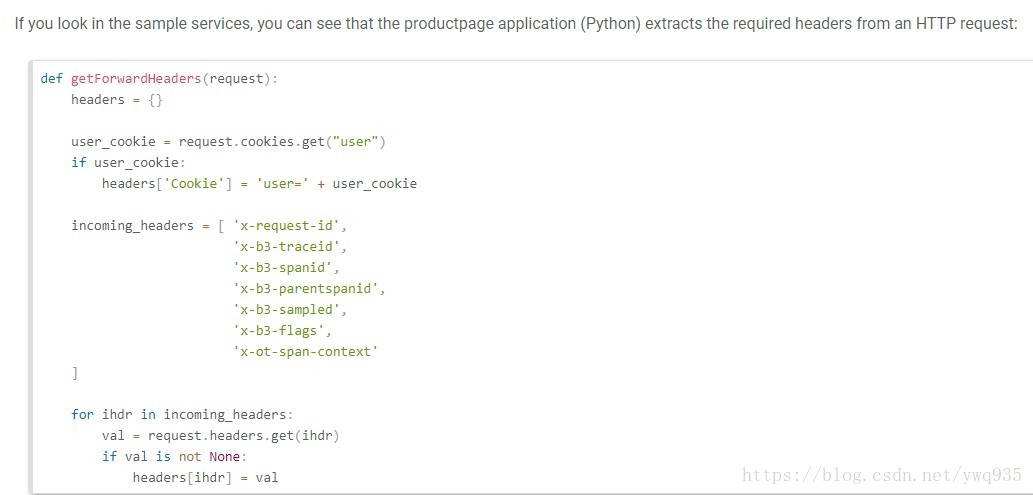
在这里测试的例子中,python服务实例使用的是flask框架,给请求头添加字段代码如下:
from apistar import App, Route, http
import platform
import requests
import logging


def getForwardHeaders(request):
    headers = {}
    incoming_headers = [
        'x-request-id',
        'x-b3-traceid',
        'x-b3-spanid',
        'x-b3-parentspanid',
        'x-b3-sampled',
        'x-b3-flags',
        'x-ot-span-context'
    ]

    for ihdr in incoming_headers:
        val = request.headers.get(ihdr)
        if val is not None:
            headers[ihdr] = val
            # print("incoming: "+ihdr+":"+val)

    return headers

def env(request: http.Request):
    forwardHeaders = getForwardHeaders(request)

    service_lua_url = 'http://' + 'service-lua' + '/env'
    resp = requests.get(service_lua_url, headers=forwardHeaders)
    data_lua = resp.json()

    service_node_url = 'http://' + 'service-node' + '/env'
    resp = requests.get(service_node_url, headers=forwardHeaders)
    data_node = resp.json()

    return {
        "message": 'Python' + platform.python_version() + '----->' + data_lua['message'] + ', ' + data_node['message']
    }

def status():
    return 'ok'

routes = [
    Route('/env', method='GET', handler=env),
    Route('/status', method='GET', handler=status),
]

app = App(routes=routes)
logging.basicConfig(level=logging.DEBUG)

if __name__ == '__main__':
    app.serve('0.0.0.0', 80, debug=True)
官方说明:
https://istio.io/docs/tasks/telemetry/distributed-tracing/