此系列文章将会描述Java框架Spring Boot、服务治理框架Dubbo、应用容器引擎Docker,及使用Spring Boot集成Dubbo、Mybatis等开源框架,其中穿插着Spring Boot中日志切面等技术的实现,然后通过gitlab-CI以持续集成为Docker镜像。
本文为Spring Boot 通过监控门面 micrometer 集成 Prometheus,再使用Grafana进行数据的实时展示
本系列文章中所使用的框架版本为Spring Boot 2.0.3-RELEASE,Spring 5.0.7-RELEASE,Dubbo 2.6.2。
监控门面,概念同日志门面
slf4j,均为基于外观设计模式所实现的规范,支持众多监控系统的应用程序Metrics外观
Micrometer
SpringBoot 2.x上已引入第三方实现的metrics Facade,默认与Micrometer集成,而Micrometer具有Prometheus的MeterRegistry规范的实现。
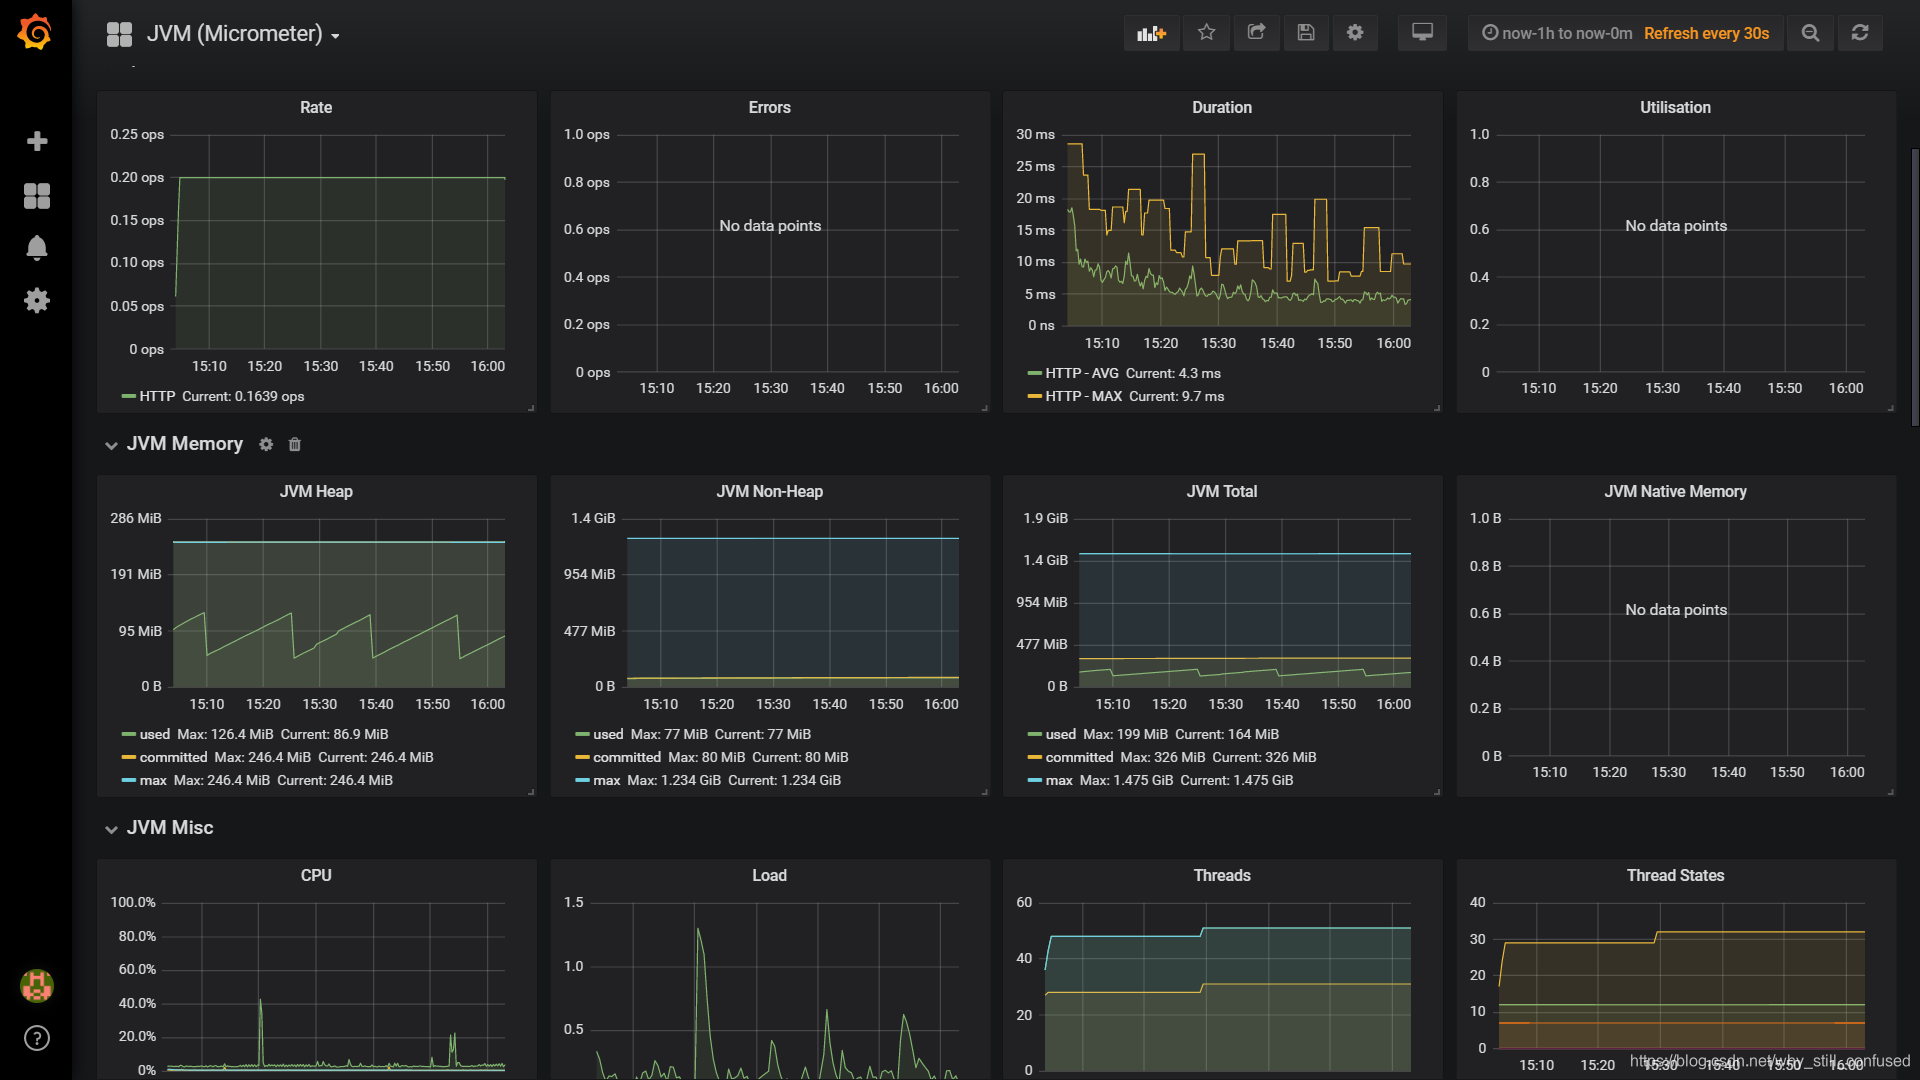
Prometheus拉取及处理SpringBoot应用中的监控数据,最后通过Grafana提供的UI界面进行数据的实时展示。
metrics tag/label
关于metrics是否支持tag/label,则代表其metrics是否能够有多维度的支持。 像statsd不支持tag,如果要区分多host的同一个jvm指标,则通常是通过添加prefix来解决,不过这个给查询统计以及后续扩展带了诸多的不变。
支持tag的好处就是可以进行多维度的统计和查询,以同一微服务但是不同实例的jvm指标来说,可以通过tag来添加host标识,这样监控系统就可以灵活根据tag查询过滤来查看不同主机粒度的,甚至是不同数据中心的粒度。
埋点
Maven依赖
<dependency>
    <groupId>org.springframework.boot</groupId>
    <artifactId>spring-boot-starter-actuator</artifactId>
    <version>${springboot.version}</version>
</dependency>

<dependency>
    <groupId>org.springframework.boot</groupId>
    <artifactId>spring-boot-starter-undertow</artifactId>
    <version>${springboot.version}</version>
</dependency>

<dependency>
    <groupId>io.micrometer</groupId>
    <artifactId>micrometer-registry-prometheus</artifactId>
    <version>1.1.2</version>
</dependency>
application配置
management.metrics.export.prometheus.enabled=true
management.metrics.export.prometheus.step=1m
management.metrics.export.prometheus.descriptions=true
management.web.server.auto-time-requests=true
management.endpoints.web.exposure.include=health,info,env,prometheus,metrics,httptrace,threaddump,heapdump
web埋点
servlet容器undertow
@SpringBootApplication
@EnableAspectJAutoProxy(proxyTargetClass = true)
@ComponentScan("com.linghit")
public class Starter {

    public static void main(String[] args) {

        new SpringApplicationBuilder(Starter.class)
                .web(WebApplicationType.SERVLET).run(args);

    }

}
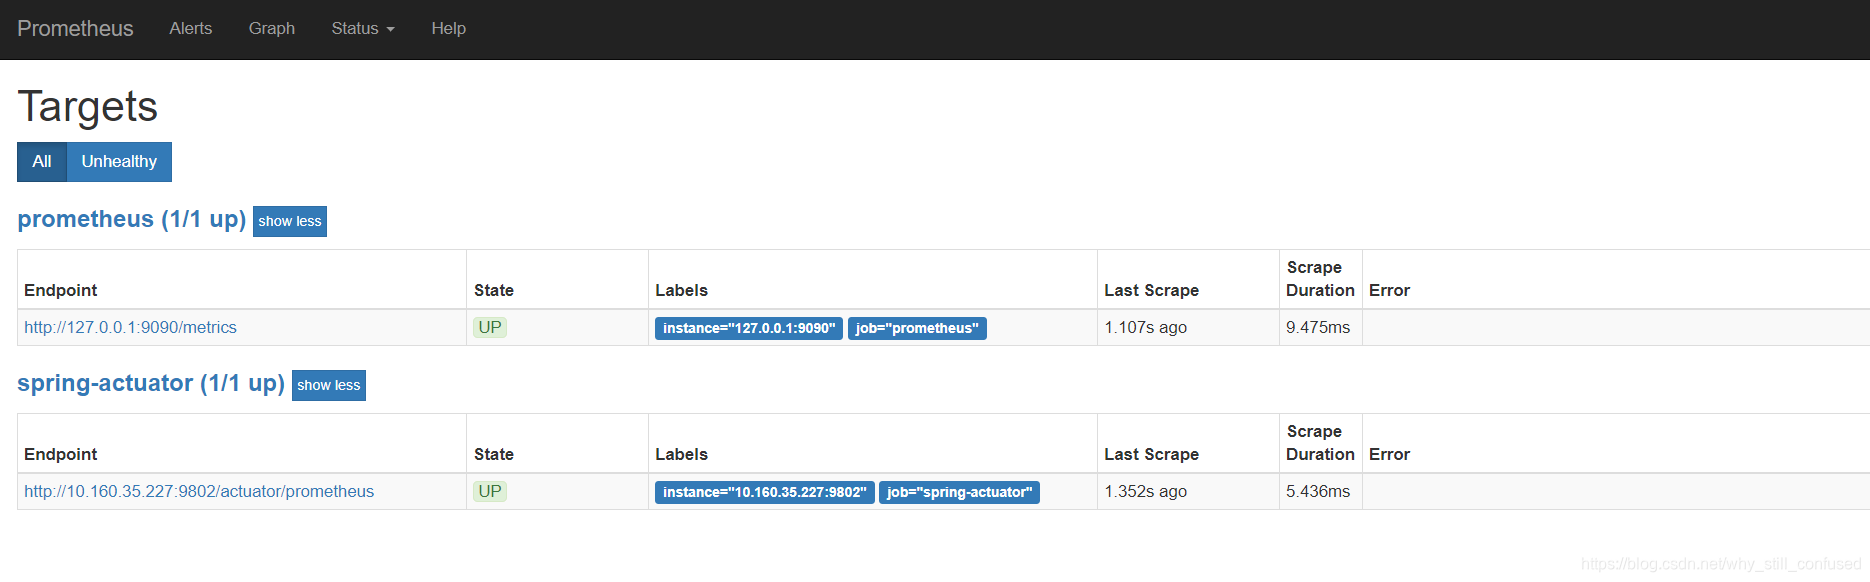
Prometheus
Prometheus是一个开源的监控系统,起源于SoundCloud。它由以下几个核心组件构成:
- 数据爬虫:根据配置的时间定期的通过HTTP抓去
metrics数据。 - time-series 数据库:存储所有的
metrics数据。 - 简单的用户交互接口:可视化、查询和监控所有的
metrics。

Docker安装
docker run -d \
--name prometheus \
--net dubbo \
--hostname prom \
-p 9090:9090 \
-v /media/raid10/tmp/prometheus/prometheus.yml:/etc/prometheus/prometheus.yml \
prom/prometheus \
--config.file=/etc/prometheus/prometheus.yml
增加
promtheus拉取数据的项目,需在挂载的配置文件prometheus.yml中增加对应的Endpoint设置并重启服务
Grafana
Grafana使你能够把来自不同数据源比如Elasticsearch, Prometheus, Graphite, influxDB等多样的数据以绚丽的图标展示出来。它也能基于你的metrics数据发出告警。当一个告警状态改变时,它能通知你通过email,slack或者其他途径。
Docker安装
docker run -d \
--name grafana \
--net dubbo \
-p 3000:3000 \
-e "GF_SERVER_ROOT_URL=http://grafana.server.name" \
-e "GF_SECURITY_ADMIN_PASSWORD=secret" \
grafana/grafana
参考资料:
1.Spring Boot Actuator: Production-ready features
2.Prometheus+Grafana实现SpringCloud服务监控
3.Micrometer Prometheus
4.基于Docker+Prometheus+Grafana监控SpringBoot健康信息
5.Micrometer
6.Spring Boot Metrics
7.聊聊springboot2的micrometer
8.Prometheus 简介