最近在使用GraphQL编写golang程序,但GraphQL框架在golang上的实践比较少,很多性能上的资料也不够全面。考虑到线上抗压的问题,笔者决定对自己开发的服务模块进行性能压测,评估下服务的整体性能。测试的工具链使用Vegeta+PPof+go-torch,PProf、go-torch上一篇文章Golang工具链 已经总结过不再赘述,vegeta会简单讲解下。
工具-vegeta
Vegeta是一个用Go语言编写的多功能的HTTP负载测试工具,提供命令行工具和开发包。安装见vegeta 说明。
Usage: vegeta [global flags] <command> [command flags]

global flags:
  -cpus int
        使用CUP的数量 (默认 4 个)
  -profile string
        Enable profiling of [cpu, heap]
  -version
        打印版本并退出

attack command:
  -body string
        请求的主体文件
  -cert string
        TLS客户PEM编码的证书文件
  -connections int
        没个目标主机最大打开闲置链接数 (默认 10000)
  -duration duration
        持续攻击时间 [0 = forever]
  -header value
        请求头
  -insecure
        忽略无效的服务器TLS证书
  -keepalive
        使用持久链接 (default true)
  -key string
        TLS客户端PEM编码的私钥文件
  -laddr value
        本地IP地址 (default 0.0.0.0)
  -lazy
        延迟懒散的读取目标
  -output string
        输出文件 (default "stdout")
  -rate uint
        每秒请求数 (default 50)
  -redirects int
        遵循重定向的次数. -1 不会遵循重定向但会标记为成功 (默认 10)
  -root-certs value
        TLS根证书文件 (逗号分隔列表)
  -targets string
        目标文件 (default "stdin")
  -timeout duration
        请求超时时间 (default 30s)
  -workers uint
        初始化进程数 (default 10)

report command:
  -inputs string
        输入文件 (comma separated) (default "stdin")
  -output string
        输出文件 (default "stdout")
  -reporter string
        表报字符格式 [text, json, plot, hist[buckets]] (default "text")
        text 文本格式
        json json格式
        plot 在 Dygraphs 上生成一个可以交互式的HTML5基础页面
        hist 计算并打印一个基于文本的直方图

dump command:
  -dumper string
        Dumper [json, csv] (default "json") 指定转储格式
  -inputs string
        Input files (comma separated) (default "stdin") 指定转储含有统计结果的输入文件,多个逗号分隔
  -output string
        Output file (default "stdout") 指定把转储文件写入到输出文件

举例:
  echo "GET http://localhost/" | vegeta attack -duration=5s | tee results.bin | vegeta report
  vegeta attack -targets=targets.txt > results.bin
  vegeta report -inputs=results.bin -reporter=json > metrics.json
  cat results.bin | vegeta report -reporter=plot > plot.html
  cat results.bin | vegeta report -reporter="hist[0,100ms,200ms,300ms]"
注意
-targets 指定一行分隔文件中的攻击目标,格式如下:
- 简单目标
GET http://goku:9090/path/to/dragon?item=balls GET http://user:password@goku:9090/path/to HEAD http://goku:9090/path/to/success- 自定义请求头的目标
GET http://user:password@goku:9090/path/to X-Account-ID: 8675309 DELETE http://goku:9090/path/to/remove Confirmation-Token: 90215 Authorization: Token DEADBEEF- 自定义请求的主体
POST http://goku:9090/things @/path/to/newthing.json PATCH http://goku:9090/thing/71988591 @/path/to/thing-71988591.json- 自定义请求头和请求主体
POST http://goku:9090/things
X-Account-ID: 99
@/path/to/newthing.json
进行负载测试时,不能因为Vegeta自身机器的性能瓶颈限制无法达到预期结果,例如打开的文件数、内存大小、CPU和网络带宽,分布式的使用Vegeta是非常好的解决方案。
- 为了确保打开文件描述和进程限制设置得高一些,可以在机器上使用
ulimit命令 - 可以使用
pdsh分布式运维工具,对目标执行分布式攻击。
- 为了确保打开文件描述和进程限制设置得高一些,可以在机器上使用
程序性能分析过程
使用vegeta工具压测http服务接口
命令
echo "POST http://192.168.168.189:8181/graphql" | vegeta attack -body /tmp/rqst/rqst.txt -duration=10s -rate=400 > r.bin对
http://192.168.168.189:8181/graphql执行post请求,post的body放置在/tmp/rqst/rqst.txt目录下,对目标地址进行持续10s的攻击,每次发送400个请求, 将请求的结果统计到r.bin文件。rqst.txt的内容如下,此处对部署在远端GraphQL服务直接发送Post请求,请求的操作名称jobInfoList:
{
    "query":"query jobInfoList(  $projectId: String!){\n\tjobInfoList(projectId: $projectId) {\n    algorithmInfo {\n      algorithmId\n      descInfo\n      location\n      name\n      sourceFormat\n      status\n      targetFormat\n      version\n    }\n  }\n}",
    "variables":{"projectId":"pr-testproject"},
    "operationName":"jobInfoList"
}
结果
text格式
/home# vegeta report -inputs=r.bin -reporter=text //查看text格式分析数据,默认为该格式,可不写
Requests      [total, rate]            4000, 400.10
Duration      [total, attack, wait]    10.0081328s, 9.997499937s, 10.632863ms
Latencies     [mean, 50, 95, 99, max]  3.978566ms, 3.635816ms, 6.189994ms, 11.539779ms, 18.534089ms
Bytes In      [total, mean]            148000, 37.00
Bytes Out     [total, mean]            1380000, 345.00
Success       [ratio]                  100.00%
Status Codes  [code:count]             200:4000
json格式
/home# vegeta report -inputs=r.bin -reporter=json
{
"latencies:{"total":15914265193,"mean":3978566,"50th":3635816,"95th":6189994,"99th":11539779,"max":18534089},
"bytes_in":{"total":148000,"mean":37},
"bytes_out":{"total":1380000,"mean":345},
"earliest":"2018-04-20T15:31:11.400851579+08:00","latest":"2018-04-20T15:31:21.398351516+08:00","end":"2018-04-20T15:31:21.408984379+08:00",
"duration":9997499937,
"wait":10632863,
"requests":4000,
"rate":400.10002752751205,
"success":1,
"status_codes":{"200":4000},
"errors":null
}
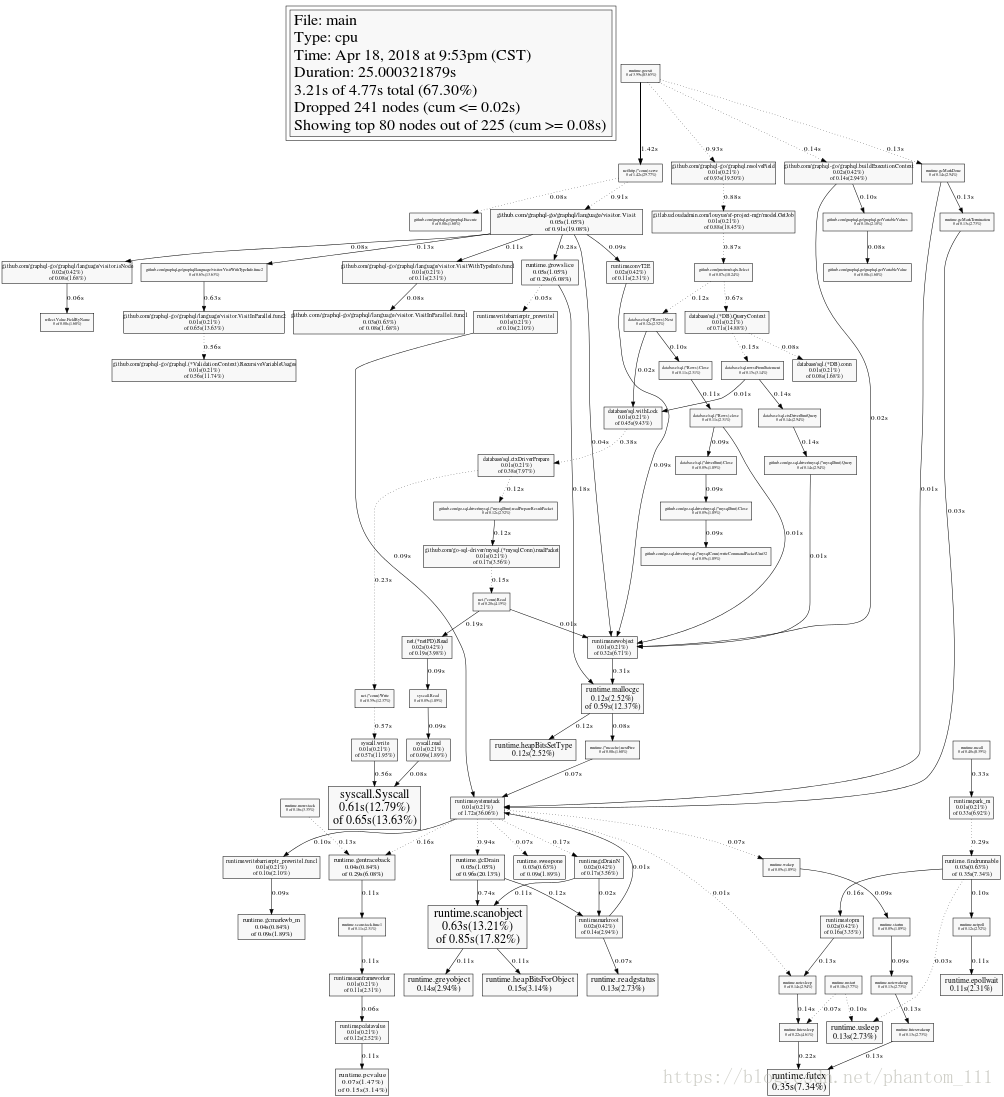
查看生成的pprof分析的可视化图片
pprof常用作cpu、内存分析,需要使用pprof的场景

- 定位内存泄露
- 程序效率瓶颈
- 查看程序的调用图
下面这张图是CPU profile,可以清楚看到程序运行时的调用状态,主要分析各个方法的耗时。下图有些部分是虚线,是因为耗时比较少的节点没有在图上体现出来 ,但要把图连起来,有的地方就使用虚线了。
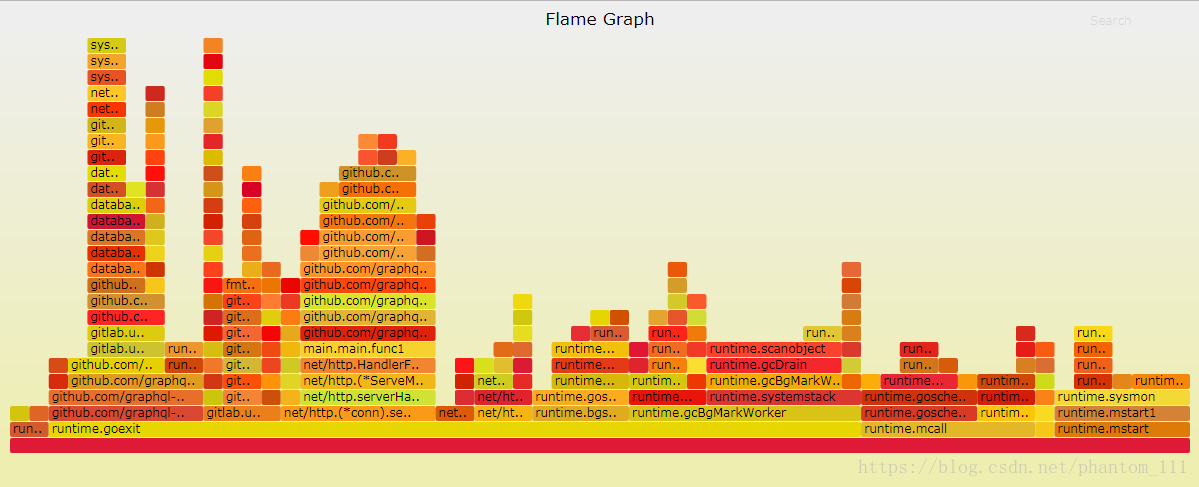
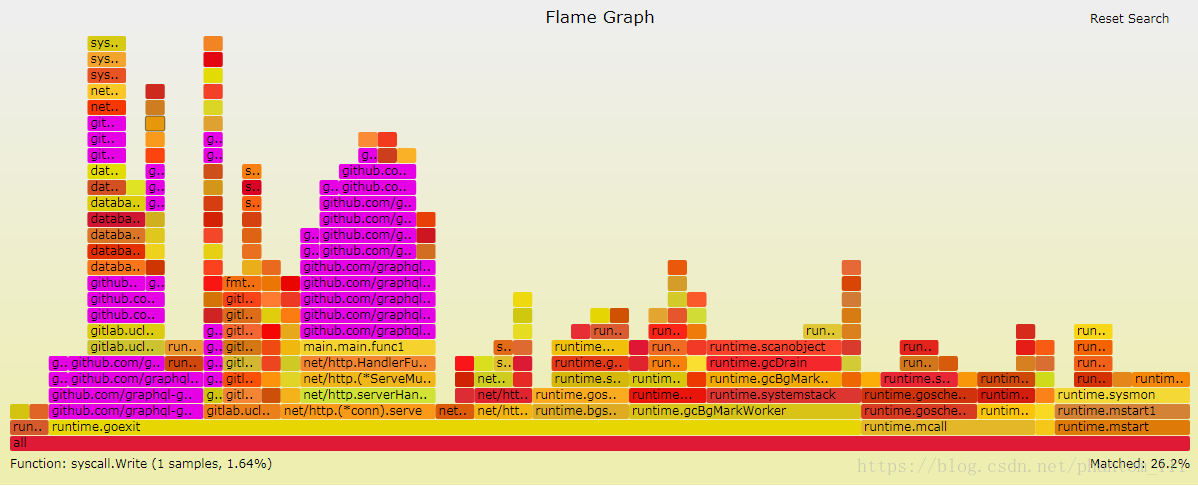
go-torch更直观的分析工具
上面的图在调用链比较简单的情况下,会比较直观,但在如此复杂的调用链下,确实看着有点乱,使用Uber开源的火焰图绝对让你打开新世界的大门。
命令
执行命令
go-torch -u http://192.168.168.189:8181 -t 10执行命令后bash展示如下内容:
INFO[14:16:19] Run pprof command: go tool pprof -raw -seconds 10 http://192.168.168.189:8181/debug/pprof/profile
INFO[14:16:30] Writing svg to torch.svg
火焰图展示
下图为使用go-torch生成的火焰图,看起来比pprof分析的要更加直观一些。
火焰图是具有互动性的:
- 鼠标悬浮: 火焰的每一层都会标注函数名,鼠标悬浮时会显示完整的函数名、抽样抽中的次数、占据总抽样次数的百分比。
- 点击放大:在某一层点击,火焰图会水平放大,该层会占据所有宽度,显示详细信息。
- 搜索:按下Ctrl + F 会显示一个搜索框,可输入关键字或正则表达式,所有符合条件的函数名会高亮显示

总结
通过以上一系列分析,笔者定位到GraphQL的解析库对程序的性能造成了一定的影响,这边总结了几种解决方式:
- 用grpc替代GraphQL
- http的Client和Server之间使用长连接进行通信
- 使用http2代替http1.1