Lab1实验报告
Exercise 3
- At what point does the processor start executing 32-bit code? What exactly causes the switch from 16- to 32-bit mode?
在0x7c2d处的指令
ljmp $PROT_MODE_CSEG, $protcseg跳转到了32位代码处,即从0x7c32处开始执行32位代码
在0x7c2a处开启cr0寄存器的PE位,从16位实模式转换到32位保护模式
- What is the last instruction of the boot loader executed, and what is the first instruction of the kernel it just loaded?
在0x7d6b处的指令
call *0x10018调用内核程序入口,所以这条指令是boot loader的最后一条指令,通过si命令可以得出内核的第一条指令,结果如下
(gdb) b *0x7d6b
Breakpoint 1 at 0x7d6b
(gdb) c
Continuing.
The target architecture is assumed to be i386
=> 0x7d6b:  call   *0x10018

Breakpoint 1, 0x00007d6b in ?? ()
(gdb) si
=> 0x10000c:    movw   $0x1234,0x472
0x0010000c in ?? ()- Where is the first instruction of the kernel?
地址为0x10000c,利用objdump命令查看内核,结果如下
hiroshi@Hiroshi-PC:~/6.828/lab/obj/kern$ objdump -f kernel
kernel:     文件格式 elf32-i386
体系结构:i386, 标志 0x00000112:
EXEC_P, HAS_SYMS, D_PAGED
起始地址 0x0010000c- How does the boot loader decide how many sectors it must read in order to fetch the entire kernel from disk? Where does it find this information?
通过Program Header Table中的信息来决定读取的扇区,利用objdump命令可以查看内核程序的段信息,结果如下
hiroshi@Hiroshi-PC:~/6.828/lab/obj/kern$ objdump -p kernel
kernel:     文件格式 elf32-i386
程序头:
    LOAD off    0x00001000 vaddr 0xf0100000 paddr 0x00100000 align 2**12
         filesz 0x0000712f memsz 0x0000712f flags r-x
    LOAD off    0x00009000 vaddr 0xf0108000 paddr 0x00108000 align 2**12
         filesz 0x0000a300 memsz 0x0000a944 flags rw-
   STACK off    0x00000000 vaddr 0x00000000 paddr 0x00000000 align 2**4
         filesz 0x00000000 memsz 0x00000000 flags rwx
Exercise 4
- Download the code for pointers.c, run it, and make sure you understand where all of the printed values come from.
这个好理解,主要是int指针和char指针增加时,由于字节大小不一致,偏移的位置不一样,导致读取的数据位置不对
Exercise 5
- Change the link address in boot/Makefrag to something wrong, run make clean, recompile the lab with make, and trace into the boot loader again to see what happens.
将地址改为0x7c04,由于BIOS会把boot loader固定加载到内存地址的0x7c00,在0x7c00处断点,执行如下指令时错误
(gdb) si
[   0:7c2d] => 0x7c2d:  ljmp   $0x8,$0x7c36
0x00007c2d in ?? ()在boot.S中找到这条指令
ljmp $PROT_MODE_CSEG, $protcseg这里涉及到了跳转,由于加载地址在0x7c04,链接计算出来的地址也进行了偏移,而内存中的地址由于是从0x7c00开始的,所以实际没有偏移,结果跳转到了错误的地址
Exercise 6
- Examine the 8 words of memory at 0x00100000 at the point the BIOS enters the boot loader, and then again at the point the boot loader enters the kernel. Why are they different? What is there at the second breakpoint?
(gdb) b *0x7c00
Breakpoint 1 at 0x7c00
(gdb) c
Continuing.
[   0:7c00] => 0x7c00:  cli

Breakpoint 1, 0x00007c00 in ?? ()
(gdb) x/8x 0x100000
0x100000:   0x00000000  0x00000000  0x00000000  0x00000000
0x100010:   0x00000000  0x00000000  0x00000000  0x00000000
(gdb) b *0x7d6b
Breakpoint 2 at 0x7d6b
(gdb) c
Continuing.
The target architecture is assumed to be i386
=> 0x7d6b:  call   *0x10018

Breakpoint 2, 0x00007d6b in ?? ()
(gdb) x/8x 0x100000
0x100000:   0x1badb002  0x00000000  0xe4524ffe  0x7205c766
0x100010: 0x34000004 0x0000b812 0x220f0011 0xc0200fd8这里很明显是因为内核程序被加载到了0x100000地址处
Exercise 7
- Use QEMU and GDB to trace into the JOS kernel and stop at the movl %eax, %cr0. Examine memory at 0x00100000 and at 0xf0100000. Now, single step over that instruction using the stepi GDB command. Again, examine memory at 0x00100000 and at 0xf0100000. Make sure you understand what just happened.
=> 0x100025:    mov    %eax,%cr0
0x00100025 in ?? ()
(gdb) x/8x 0x100000
0x100000:   0x1badb002  0x00000000  0xe4524ffe  0x7205c766
0x100010:   0x34000004  0x0000b812  0x220f0011  0xc0200fd8
(gdb) x/8x 0xf0100000
0xf0100000 <_start+4026531828>: 0x00000000  0x00000000  0x00000000  0x00000000
0xf0100010 <entry+4>:   0x00000000  0x00000000  0x00000000  0x00000000
(gdb) si
=> 0x100028:    mov    $0xf010002f,%eax
0x00100028 in ?? ()
(gdb) x/8x 0x100000
0x100000:   0x1badb002  0x00000000  0xe4524ffe  0x7205c766
0x100010:   0x34000004  0x0000b812  0x220f0011  0xc0200fd8
(gdb) x/8x 0xf0100000
0xf0100000 <_start+4026531828>: 0x1badb002  0x00000000  0xe4524ffe  0x7205c766
0xf0100010 <entry+4>:   0x34000004  0x0000b812  0x220f0011  0xc0200fd8
在执行指令
movl %eax, %cr0之前,0xf0100000内存地址处的数据为空,而在执行指令之后,0xf0100000地址被映射到了0x100000地址,可以看出,它们的数据是相同的
- What is the first instruction after the new mapping is established that would fail to work properly if the mapping weren’t in place? Comment out the movl %eax, %cr0 in kern/entry.S, trace into it, and see if you were right.
在注释掉
movl %eax, %cr0之后,可以看到,运行到地址0xf010002c时就出错了
=> 0x10001d:    mov    %cr0,%eax
0x0010001d in ?? ()
(gdb) si
=> 0x100020:    or     $0x80010001,%eax
0x00100020 in ?? ()
(gdb) si
=> 0x100025:    mov    $0xf010002c,%eax
0x00100025 in ?? ()
(gdb) si
=> 0x10002a:    jmp    *%eax
0x0010002a in ?? ()
(gdb) si
=> 0xf010002c <relocated>:  add    %al,(%eax)
relocated () at kern/entry.S:74
74      movl    $0x0,%ebp          # nuke frame pointer
(gdb) si
Remote connection closed
错误提示如下
qemu: fatal: Trying to execute code outside RAM or ROM at 0xf010002c由于C代码被链接到KERNBASE+1MB处,所以跳转地址为0xf010002c,而此时没有开启分页机制,导致了访问地址0xf010002c出错
Exercise 8
填写代码比较简单,仿照%x处的写法即可
- Explain the interface between printf.c and console.c. Specifically, what function does console.c export? How is this function used by printf.c?
console.c中暴露了cputchar函数,被printf.c中的putch函数调用
- Explain the following from console.c
1:判断当前光标的位置是否到了屏幕最后或超出屏幕
3:将屏幕中从第二行开始往前移动一行,目的是空出新的最后一行
4:这个循环将最后一行用空格填满以表示新行
6:将光标移动到行首
- In the call to cprintf(), to what does fmt point? To what does ap point?List (in order of execution) each call to cons_putc, va_arg, and vcprintf. For cons_putc, list its argument as well. For va_arg, list what ap points to before and after the call. For vcprintf list the values of its two arguments.
fmt指向第一个参数,ap指向第二个参数
这里就不按要求列出了,就说下ap指针,cprinft含有一个可变参数列表,而实现可变参数的一个事实是,函数的参数是从右向左入栈的,也就是说,将通过ap指针指向第一个参数,于是ap指针增加1就指向下一个参数,所以调用va_arg前后ap分别指向当前的参数和下一个参数
- What is the output? Explain how this output is arrived at in the step-by-step manner of the previous exercise.If the x86 were instead big-endian what would you set i to in order to yield the same output? Would you need to change 57616 to a different value?
输出为He110 World
10进制数57616转换到16进制结果为0xe110
在ASCII码中,0x00 0x64 0x6c 0x72对应值为[NUL] d l r
由于是小端机器所以打印顺序位相反,即rld[NUL]
如果是大端机器的话,i的值改为0x726c6400,57616不用更改
- In the following code, what is going to be printed after ‘y=’? (note: the answer is not a specific value.) Why does this happen?
这里的y值是未定义的,取决于栈指针所指向的下一个值
Challenge
要修改颜色的话,首先要知道哪段代码是决定颜色的,在之前要求阅读console.c的时候,发现控制颜色的代码位于cga_putc函数内,具体来说的话,就是以下两行
if (!(c & ~0xFF))  // 如果没有颜色控制信息(后 8 位)
c |= 0x0100; // 0x07 = 00000111 前景白 背景黑 不闪烁字符c的前16位结构与颜色对应表如下
| 15 14 13 12 | 11 10 9 8 | 7 6 5 4 3 2 1 0 |
|---|---|---|
| 背景色 | 前景色 | 字符 |
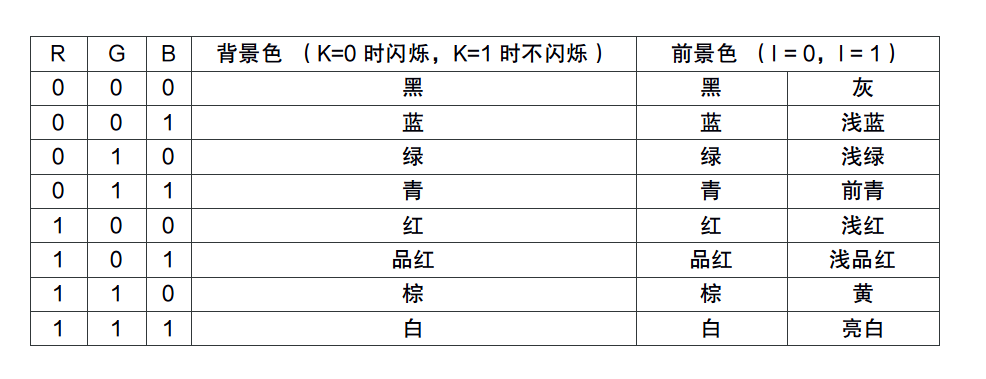
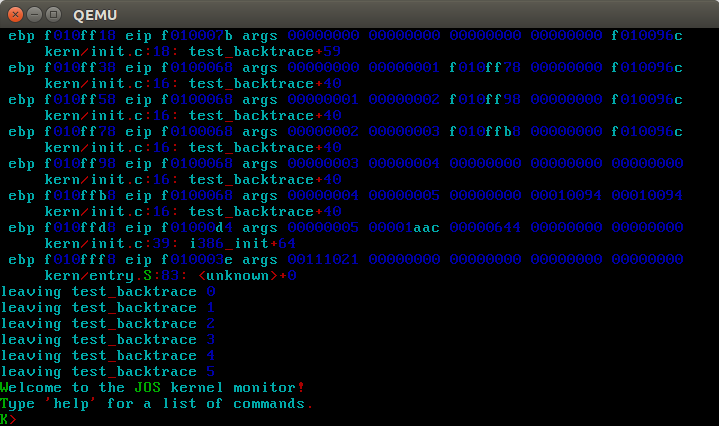
有了以上的知识,我们可以简单的实现控制台颜色,以下是我的实现代码
if (!(c & ~0xFF)) {
    char ch = c & 0xFF;
    if (ch > 47 && ch < 58) {
        c |= 0x0100;
    } else if (ch > 64 && ch < 91) {
        c |= 0x0200;
    } else if (ch > 96 && ch < 123) {
        c |= 0x0300;
    } else {
        c |= 0x0400;
    }
}
上述代码在字符为数字、大小写字母与其他时分别显示不同颜色,效果如下
Exercise 9
- Determine where the kernel initializes its stack, and exactly where in memory its stack is located. How does the kernel reserve space for its stack? And at which “end” of this reserved area is the stack pointer initialized to point to?
在entry.S中可以看到以下两条指令用于初始化栈
movl    $0x0,%ebp
movl $(bootstacktop),%esp在kernel.asm中可以看栈顶位于0xf0110000
以下指令用于保留栈空间
bootstack:
.space KSTKSIZE栈的大小为KSTKSIZE,宏定义位于mmu.h中,值为32KB
由于栈是向下增长的,所以栈顶指针指向保留空间高位端
Exercise 10
- examine what happens each time it gets called after the kernel starts. How many 32-bit words does each recursive nesting level of test_backtrace push on the stack, and what are those words?
通过gdb单步执行,观察得出,栈的结构大概是这个样子
|    ...    |
|   args1   |
|  ret  eip |
| saved ebp |
| saved ebx |
|   args5   |
|   args4   |
|   args3   |
|   args2   |
|   args1   |
|  ret  eip |
| saved ebp |
| saved ebx |
| ... |每次调用call会往栈里面压入当前eip的值,并且将call后面的地址写入eip
Exercise 11
- Implement the backtrace function as specified above.
通过上面的练习得出的结构,可以写出类似如下程序
printf("Stack backtrace:\n");
uint32_t *ebp = (uint32_t *) read_ebp();
cprintf("Stack backtrace:\n");
while (ebp) {
    cprintf(" ebp %08x eip %08x args ", ebp, ebp[1]);
    for (int j = 2; j != 7; ++j) {
        cprintf(" %08x", ebp[j]);
    }
    cprintf("\n");
    ebp = (uint32_t *) (*ebp);
}
return 0;
Exercise 12
- Complete the implementation of debuginfo_eip by inserting the call to stab_binsearch to find the line number for an address.Add a backtrace command to the kernel monitor.
在debuginfo_eip中,经分析后,发现需要添加类似如下代码
info->eip_file = stabstr + stabs[lfile].n_strx;

stab_binsearch(stabs, &lline, &rline, N_SLINE, addr);
if (lline > rline) {
    return -1;
} else {
    info->eip_line = stabs[rline].n_desc;
}
之后便是按照给定格式打印信息
struct Eipdebuginfo info;
uint32_t *ebp = (uint32_t *) read_ebp();
cprintf("Stack backtrace:\n");
while (ebp) {
    cprintf(" ebp %08x eip %08x args", ebp, ebp[1]);
    for (int j = 2; j != 7; ++j) {
        cprintf(" %08x", ebp[j]);
    }
    debuginfo_eip(ebp[1], &info);
    cprintf("\n     %s:%d: %.*s+%d\n", info.eip_file, info.eip_line, info.eip_fn_namelen, info.eip_fn_name, ebp[1] - info.eip_fn_addr);
    ebp = (uint32_t *) (*ebp);
}补充完后,make grade通过!