Exercise 12
问题1:debuginfo_eip函数中的_STAB_*来自哪里?
打开文件kern/kernel.ld,可以看到.stab段和.stabstr段。__STAB_BEGIN__,__STAB_END__,__STABSTR_BEGIN__,__STABSTR_END__符号分别代表.stab段和.stabstr段开始与结束的地址,在kernel.ld文件中均有定义。
/* Include debugging information in kernel memory */
        .stab : {
                PROVIDE(__STAB_BEGIN__ = .);
                *(.stab);
                PROVIDE(__STAB_END__ = .);
                BYTE(0)         /* Force the linker to allocate space
                                   for this section */
        }

        .stabstr : {
                PROVIDE(__STABSTR_BEGIN__ = .);
                *(.stabstr);
                PROVIDE(__STABSTR_END__ = .);
                BYTE(0)         /* Force the linker to allocate space
                                   for this section */
        }
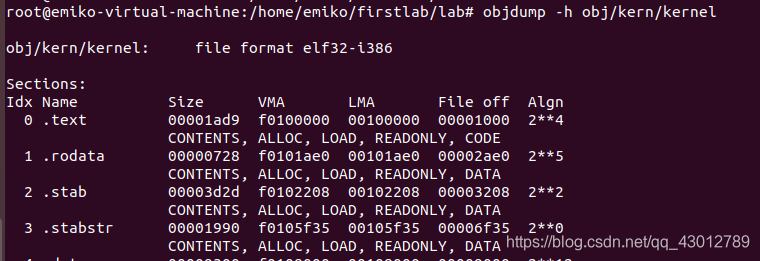
通过objdump -h obj/kern/kernel指令可以查看到.stabstr段的加载内存地址。
确认boot loader在加载内核时是否把符号表也加载到内存中。怎么确认呢?使用gdb查看符号表的位置是否存储有符号信息。
查看时发现并无符号信息。猜测是由于没有设置断点?所以在gdb内核没有加载,更别提加载符号表了。因为不知道该把断点设置在哪里,先占下坑。
问题2:通过插入对stab_binsearch的调用来查找地址的行号,从而完成debuginfo_eip的实现。
问题的关键是熟悉stabs每行记录的含义。使用objdump -G obj/kern/kernel > output.md将内核的符号表信息输入到output.md文件中,在output.md文件中查看(节选):
Symnum n_type n_othr n_desc n_value  n_strx String
118    FUN    0      0      f01000a6 2987   i386_init:F(0,25)
119    SLINE  0      24     00000000 0
120    SLINE  0      30     00000012 0
121    SLINE  0      34     00000029 0
122    SLINE  0      37     0000002e 0
每个字段的含义是:
Symnum是符号索引,把整个符号表看做一个数组,Symnum是当前符号的数组下标。
n_type是符号类型,FUN指函数名(在String字段下显示函数名),SLINE值在text段中的行号。
n_othr表示目前没被使用,固定值为0
n_desc表示在文件中的行号。
n_value表示地址。需要注意的是,只有FUN符号类型的地址是绝对地址,SLINE符号的地址是偏移地址,其实际地址是函数入口地址加偏移地址,比如第120行的地址是函数入口地址0xf01000a6+偏移地址00000012=0xf01000b8,代码对应在文件的第34行。
开始代码的编写。
stab_binsearch函数的作用是查找某一个地址所在的区间,在之前的函数中已经找到了地址在哪个函数里面以及函数入口地址,将入口地址与偏移量相加得到了某行对应地址。因此打开kern/kdebug.c文件,在debuginfo_eip函数中编写代码如下得到行号:
 // Your code here.
        stab_binsearch(stabs,&lline,&rline,N_SLINE,addr);
        if(lline<=rline){
           info->eip_line = stabs[lline].n_desc;
        }else{
                cprintf("line not find\n");
        }
问题三:给内核模拟器增加backtrace命令,并在mon_backtrace中增加打印文件名、函数名和行号。
1.给内核模拟器增加backtrace命令,直接在kern/monitor.c文件中模仿已有命令添加即可。
static struct Command commands[] = {
        { "help", "Display this list of commands", mon_help },
        { "kerninfo", "Display information about the kernel", mon_kerninfo },
        {"backtrace","Display a backtrace of the function stack",mon_backtrace},
};
2.在mon_backtrace中增加打印文件名、函数名和行号。
debuginfo_eip函数的功能是根据地址寻找函数行号。
代码如下。值得注意的是,返回的Eipdebuginfo结构体的eip_fn_name字段除了函数名外还有一段尾巴,比如test_backtrace:F(0,25),需要将":F(0,25)"去掉,可以使用printf("%.*s", length, string)来实现。
另外有一疑惑:ebp[i]是什么意思?mark一下。
int
mon_backtrace(int argc, char **argv, struct Trapframe *tf)
{
        // Your code here.
        uint32_t *ebp;
        struct Eipdebuginfo info;
        int result;
        ebp = (uint32_t*)read_ebp();
        cprintf("Stack backtrace:\r\n");

        while(ebp){
        cprintf("    ebp %08x eip %08x args %08x %08x %08x %08x %08x\r\n",ebp,ebp[1],ebp[2],ebp[3],ebp[4],ebp[5],ebp[6]);//ebp[i] what meaning?
        memset(&info,0,sizeof(struct Eipdebuginfo));
        result = debuginfo_eip(ebp[1],&info);
        if(result){
           cprintf("failed\r\n",ebp[1]);
        }else{
        cprintf("\t%s:%d: %.*s+%u\r\n",info.eip_file,info.eip_line,info.eip_fn_namelen,info.eip_fn_name,ebp[1]-info.eip_fn_addr);
        }
        ebp = (uint32_t*)*ebp;
        }
        return 0;
}
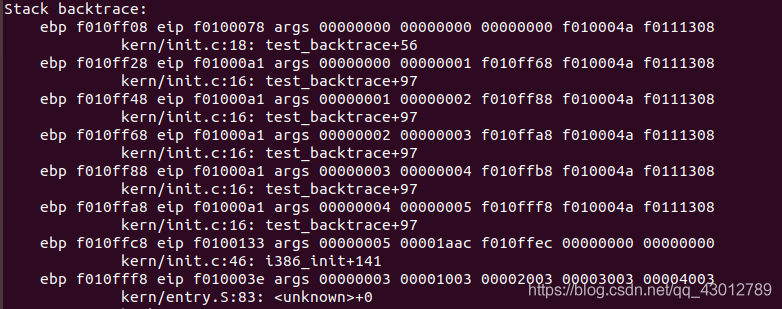
最后展示一下实验结果:
mon_backtrace函数的输出结果。
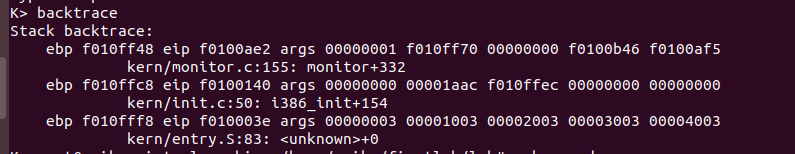
输入内核指令backtrace的结果。
Lab1的评分
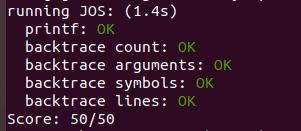
到此,Lab1的实验就结束啦。
参考文章:https://www.cnblogs.com/wuhualong/p/lab01_exercise12_print_more_info.html