import numpy as np
import matplotlib.pyplot as plt
plt.style.use('ggplot')
N=500
# loc:float
# 此概率分布的均值(对应着整个分布的中心centre)
# scale:float
# 此概率分布的标准差(对应于分布的宽度,scale越大越矮胖,scale越小,越瘦高)
# size:int or tuple of ints
# 输出的shape,默认为None,只输出一个值
normal=np.random.normal(loc=0.0,scale=1.0,size=N)
# 从具有指定平均值,标准偏差和阵列形状的对数正态分布中绘制样本。请注意,平均值和标准差不是分布本身的值,而是其来源的基本正态分布。
lognormal=np.random.lognormal(mean=0.0,sigma=1.0,size=N)
index_value=np.random.random_integers(low=0,high=N-1,size=N) #类型为np.int的随机整数,包括低和高
normal_sample=normal[index_value]
lognormal_sample=lognormal[index_value]
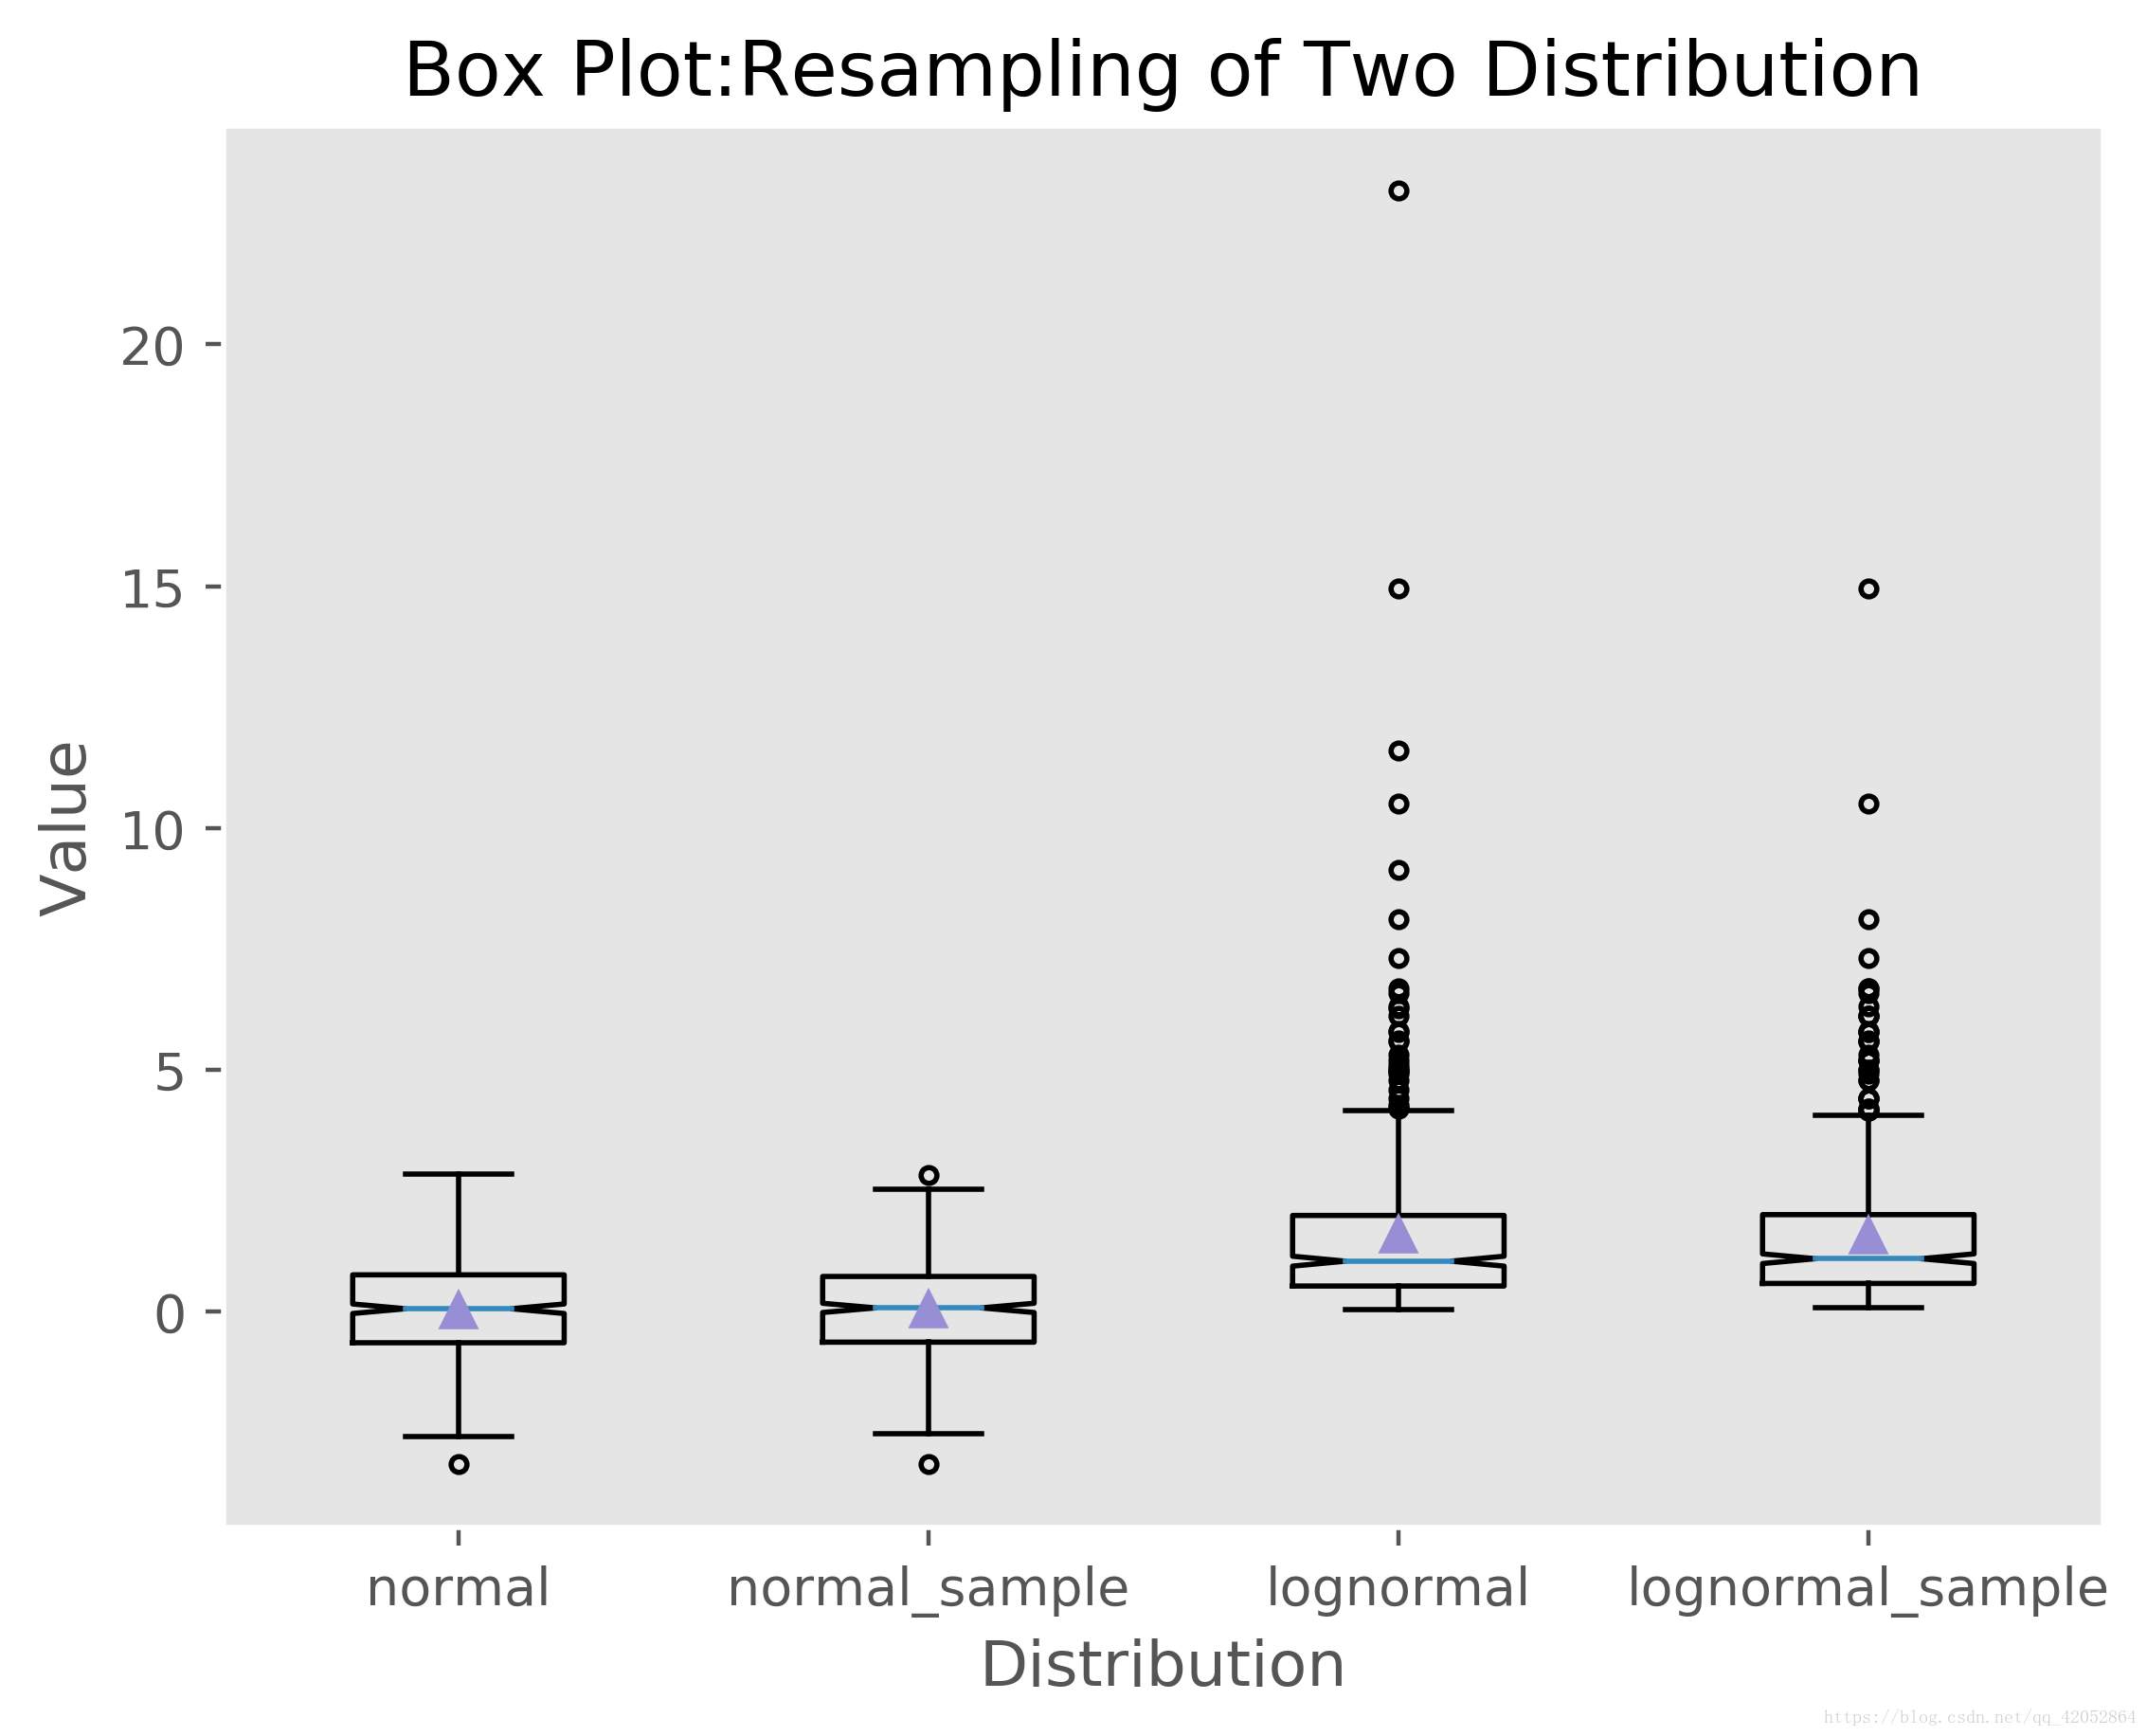
box_plot_data=[normal,normal_sample,lognormal,lognormal_sample]
fig=plt.figure()
ax=fig.add_subplot(1,1,1)
box_labels=['normal','normal_sample','lognormal','lognormal_sample'] #每个箱图的标签
# sym='.',表示异常点的形状,
# vert=Treu,表示横向还是竖向(True),,
# patch_artist=True,(上下四分位框内是否填充,True为填充)
# meanline=False,showmeans=True,是否有均值线及其形状,meanline=True时,均值线也像中位数线一样是条红色线段,这样容易与中位数线混淆。
# 另外,还有其他参数,比如notch表示中间箱体是否缺口,whis为设置数据的范围,showcaps、showbox是否显示边框,
ax.boxplot(box_plot_data,notch=False,sym='.',vert=True,whis=1.5,showmeans=True,labels=box_labels)
ax.xaxis.set_ticks_position('bottom')
ax.yaxis.set_ticks_position('left')
ax.set_title('Box Plot:Resampling of Two Distribution')
ax.set_xlabel('Distribution')
ax.set_ylabel('Value')
plt.grid()
plt.savefig('E:\python\慕课网 python\.idea\photo\Box Plot.png',dpi=400,bbox_inches='tight')
plt.show()Box plot
猜你喜欢
转载自blog.csdn.net/qq_42052864/article/details/81708445
今日推荐
周排行