本篇博客只是单纯的记录一下自己学习Boxplot,没有过多的解释,官网:》》Boxplot
import seaborn as sns
import numpy as np
import pandas as pd
import matplotlib as mpl
import matplotlib.pyplot as plt
%matplotlib inline
plt.rcParams['font.sans-serif']=['Microsoft YaHei'] # 用来正常显示中文标签
plt.rcParams['axes.unicode_minus']=False # 用来正常显示负号
from datetime import datetime
plt.figure(figsize=(16,10))
import pyecharts.options as opts
from pyecharts.charts import Line
from pyecharts.faker import Faker
from pyecharts.charts import Bar
import os
from pyecharts.options.global_options import ThemeType
cnboo=pd.read_excel("c.xls")
处理数据:
cnbotypegb=cnboo.groupby(['TYPE','SHOWYEAR'])['BO'].sum().replace()
cnbotypegbrst=cnbotypegb.reset_index().replace()
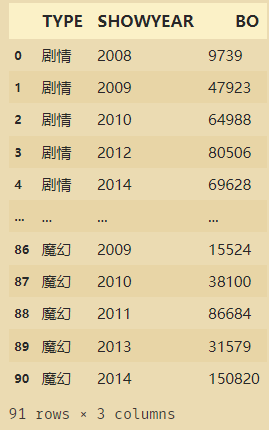
filmtype=cnbotypegbrst['TYPE'].unique()

对行标签和列标签进行转置:
cnbotypegbrst.T.index
cnbopvt=cnbotypegbrst.pivot(index='TYPE',
                           columns='SHOWYEAR',
                            values='BO'
                           )
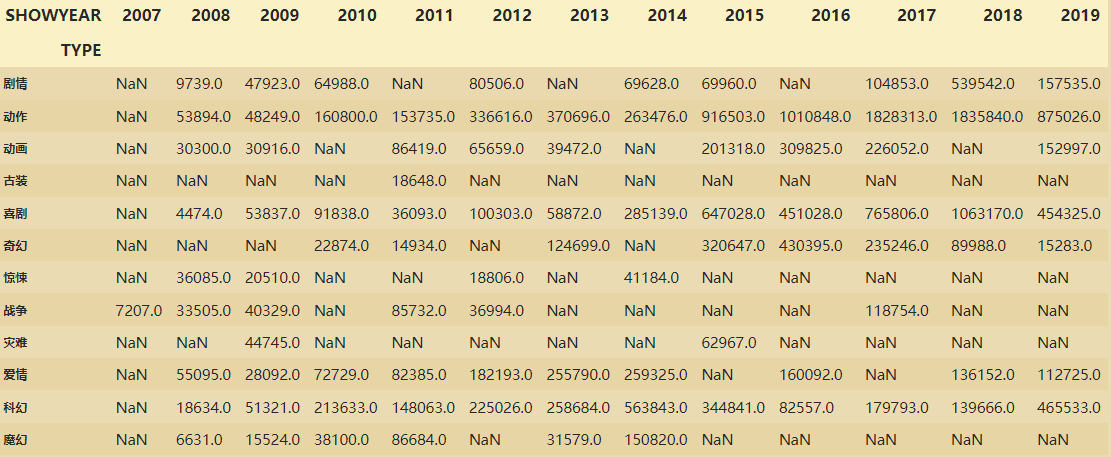
cnbopvtv2=cnbopvt.iloc[:,2:].replace()
cnbopvtv2.index
cnbopvtv2=cnbopvtv2.fillna(0).replace()
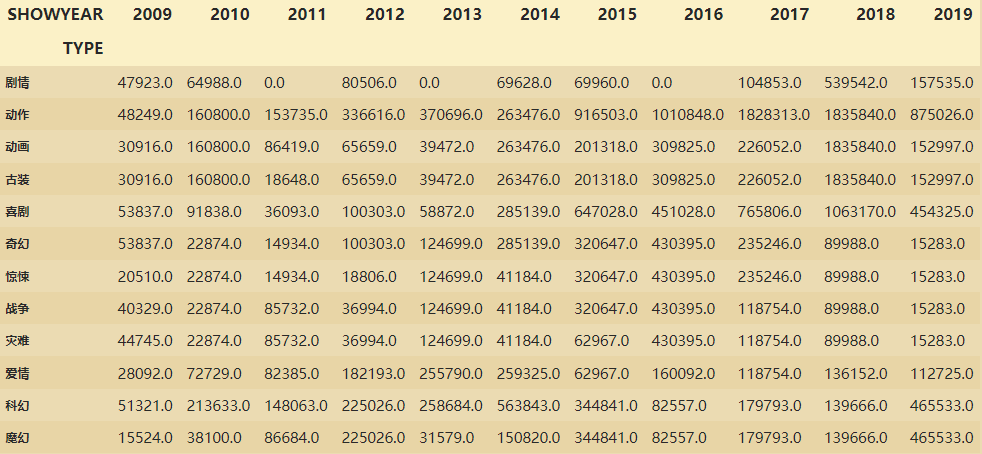
xlist=cnbopvtv2.index.tolist()
xlist一共有12个,因此循环12次:
y_data=[]
for i in range(0,12):
    y_data.append(cnbopvtv2.iloc[i].tolist())
得到的y_data数据:
[[47923.0,
  64988.0,
  0.0,
  80506.0,
  0.0,
  69628.0,
  69960.0,
  0.0,
  104853.0,
  539542.0,
  157535.0],
 [48249.0,
  160800.0,
  153735.0,
  336616.0,
  370696.0,
  263476.0,
  916503.0,
  1010848.0,
  1828313.0,
  1835840.0,
  875026.0],
 [30916.0,
  160800.0,
  86419.0,
  65659.0,
  39472.0,
  263476.0,
  201318.0,
  309825.0,
  226052.0,
  1835840.0,
  152997.0],
 [30916.0,
  160800.0,
  18648.0,
  65659.0,
  39472.0,
  263476.0,
  201318.0,
  309825.0,
  226052.0,
  1835840.0,
  152997.0],
 [53837.0,
  91838.0,
  36093.0,
  100303.0,
  58872.0,
  285139.0,
  647028.0,
  451028.0,
  765806.0,
  1063170.0,
  454325.0],
 [53837.0,
  22874.0,
  14934.0,
  100303.0,
  124699.0,
  285139.0,
  320647.0,
  430395.0,
  235246.0,
  89988.0,
  15283.0],
 [20510.0,
  22874.0,
  14934.0,
  18806.0,
  124699.0,
  41184.0,
  320647.0,
  430395.0,
  235246.0,
  89988.0,
  15283.0],
 [40329.0,
  22874.0,
  85732.0,
  36994.0,
  124699.0,
  41184.0,
  320647.0,
  430395.0,
  118754.0,
  89988.0,
  15283.0],
 [44745.0,
  22874.0,
  85732.0,
  36994.0,
  124699.0,
  41184.0,
  62967.0,
  430395.0,
  118754.0,
  89988.0,
  15283.0],
 [28092.0,
  72729.0,
  82385.0,
  182193.0,
  255790.0,
  259325.0,
  62967.0,
  160092.0,
  118754.0,
  136152.0,
  112725.0],
 [51321.0,
  213633.0,
  148063.0,
  225026.0,
  258684.0,
  563843.0,
  344841.0,
  82557.0,
  179793.0,
  139666.0,
  465533.0],
 [15524.0,
  38100.0,
  86684.0,
  225026.0,
  31579.0,
  150820.0,
  344841.0,
  82557.0,
  179793.0,
  139666.0,
  465533.0]]
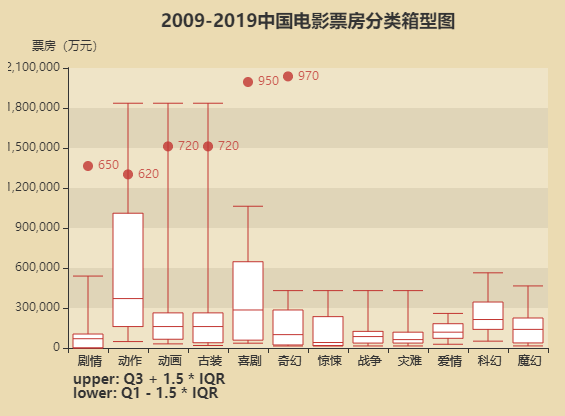
最后绘制图表:
import pyecharts.options as opts
from pyecharts.charts import Grid, Boxplot, Scatter

scatter_data = [650, 620, 720, 720, 950, 970]

box_plot = Boxplot({

    "Theme":ThemeType.ESSOS})

box_plot = (
    box_plot.add_xaxis(xaxis_data=xlist)
    .add_yaxis(series_name="", y_axis=box_plot.prepare_data(y_data))
    .set_global_opts(
        title_opts=opts.TitleOpts(
            pos_left="center", title="2009-2019中国电影票房分类箱型图"
        ),
        tooltip_opts=opts.TooltipOpts(trigger="item", axis_pointer_type="shadow"),
        xaxis_opts=opts.AxisOpts(
            type_="category",
            boundary_gap=True,
            splitarea_opts=opts.SplitAreaOpts(is_show=False),
            axislabel_opts=opts.LabelOpts(formatter="{value}"),
            splitline_opts=opts.SplitLineOpts(is_show=False),
        ),
        yaxis_opts=opts.AxisOpts(
            type_="value",
            name="票房(万元)",
            splitarea_opts=opts.SplitAreaOpts(
                is_show=True, areastyle_opts=opts.AreaStyleOpts(opacity=1)
            ),
        ),
    )
    .set_series_opts(tooltip_opts=opts.TooltipOpts(formatter="{a}: {c}"))
)# {a}:系列名称,{b}:数据名称,{c}:数值数组,{d}:无

scatter = (
    Scatter()
    .add_xaxis(xaxis_data=xlist)
    .add_yaxis(series_name="", y_axis=scatter_data)
    .set_global_opts(
        title_opts=opts.TitleOpts(
            pos_left="10%",
            pos_top="90%",
            title="upper: Q3 + 1.5 * IQR \nlower: Q1 - 1.5 * IQR",
            title_textstyle_opts=opts.TextStyleOpts(
                border_color="#999", border_width=1, font_size=14
            ),
        ),
        yaxis_opts=opts.AxisOpts(
            axislabel_opts=opts.LabelOpts(is_show=False),
            axistick_opts=opts.AxisTickOpts(is_show=False),
        ),
    )
)

grid = (
    Grid(init_opts=opts.InitOpts(width="600px", height="400px"))
    .add(
        box_plot,
        grid_opts=opts.GridOpts(pos_left="10%", pos_right="10%", pos_bottom="15%"),
    )
    .add(
        scatter,
        grid_opts=opts.GridOpts(pos_left="10%", pos_right="10%", pos_bottom="15%"),
    )
)
grid.render_notebook()
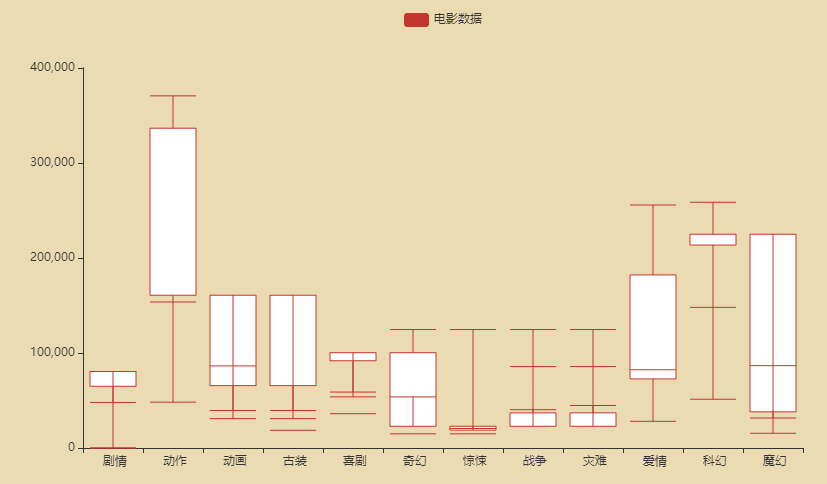
也可以直接使用下面的代码,简单的绘制一张图:
boxplot=(Boxplot()
        .add_xaxis(xlist)
        .add_yaxis("电影数据",y_data)
        )
boxplot.render_notebook()
扫描二维码关注公众号,回复:
13753806 查看本文章
