QCustomPlot实现矩形缩放图表
意图
我们知道图表有些基本的功能,比如放大(ZoomIn)、缩小(ZoomOut)、拖拽(Drag)、恢复(1:1或ZoomReset)。这些功能QCustomPlot已经几乎都有了,但是选择矩形区域进行缩放的功能没有给出很好的接口,这可能就要我们自己实现了,这就是写这篇文章的目的。
实现
QCustomPlot本身有缩放的功能,但是没有实现矩形缩放的接口,所以实现的话无非是在图表上面实现鼠标选择的矩形区域,然后进行比例缩放。我们借助Qt自带的QRubberBand来实现矩形选择区域。看帮助文档和源码,我们可以看到当鼠标在图表区域上的时候,包括鼠标按下,移动,释放,这些动作会发送信号。
所以有两种方法实现:
- 我们只要以父控件实现槽函数来绑定这些信号来做特定处理就行了
- 实现QCustomPlot的子类,重载鼠标按下,移动,释放等鼠标事件函数
父控件槽函数实现方法
按照QCustomPlot提供的例子,我们写一个最简单的例子。
把QCustomPlot设为MainWindow的centralWidget。
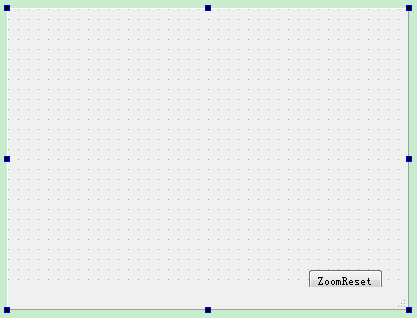
少废话了,上源码吧:
MainWindow的头文件
#ifndef MAINWINDOW_H
#define MAINWINDOW_H

#include <QMainWindow>
#include <QRubberBand>
namespace Ui {
class MainWindow;
}

class MainWindow : public QMainWindow
{
    Q_OBJECT

public:
    explicit MainWindow(QWidget *parent = 0);
    ~MainWindow();
private slots:

    void mousePress(QMouseEvent* mevent);

    void mouseMove(QMouseEvent *mevent);

    void mouseRelease(QMouseEvent *mevent);

    void slotBtn();

private:
    Ui::MainWindow *ui;
    QRubberBand *rubberBand;
    QPoint rubberOrigin;
};

#endif // MAINWINDOW_H
MainWindow的构造函数实现
//初始化QRubberBand
rubberBand = new QRubberBand(QRubberBand::Rectangle, ui->customPlot);

//从自带的例子中复制的代码
ui->customPlot->addGraph();
ui->customPlot->graph(0)->setPen(QPen(Qt::blue)); // line color blue for first graph
ui->customPlot->graph(0)->setBrush(QBrush(QColor(0, 0, 255, 20))); // first graph will be filled with translucent blue
ui->customPlot->addGraph();
ui->customPlot->graph(1)->setPen(QPen(Qt::red)); // line color red for second graph
// generate some points of data (y0 for first, y1 for second graph):
QVector<double> x(250), y0(250), y1(250);
for (int i=0; i<250; ++i)
{
  x[i] = i;
  y0[i] = qExp(-i/150.0)*qCos(i/10.0); // exponentially decaying cosine
  y1[i] = qExp(-i/150.0);              // exponential envelope
}
// configure right and top axis to show ticks but no labels:
// (see QCPAxisRect::setupFullAxesBox for a quicker method to do this)
ui->customPlot->xAxis2->setVisible(true);
ui->customPlot->xAxis2->setTickLabels(false);
ui->customPlot->yAxis2->setVisible(true);
ui->customPlot->yAxis2->setTickLabels(false);
// make left and bottom axes always transfer their ranges to right and top axes:
connect(ui->customPlot->xAxis, SIGNAL(rangeChanged(QCPRange)), ui->customPlot->xAxis2, SLOT(setRange(QCPRange)));
connect(ui->customPlot->yAxis, SIGNAL(rangeChanged(QCPRange)), ui->customPlot->yAxis2, SLOT(setRange(QCPRange)));
// pass data points to graphs:
ui->customPlot->graph(0)->setData(x, y0);
ui->customPlot->graph(1)->setData(x, y1);
// let the ranges scale themselves so graph 0 fits perfectly in the visible area:
ui->customPlot->graph(0)->rescaleAxes();
// same thing for graph 1, but only enlarge ranges (in case graph 1 is smaller than graph 0):
ui->customPlot->graph(1)->rescaleAxes(true);
// Note: we could have also just called customPlot->rescaleAxes(); instead
// Allow user to drag axis ranges with mouse, zoom with mouse wheel and select graphs by clicking:
ui->customPlot->setInteractions(QCP::iRangeDrag | QCP::iRangeZoom | QCP::iSelectPlottables);

//连接鼠标事件发出的信号,实现绑定
connect(ui->customPlot, SIGNAL(mousePress(QMouseEvent*)), this, SLOT(mousePress(QMouseEvent*)));
connect(ui->customPlot, SIGNAL(mouseMove(QMouseEvent*)), this, SLOT(mouseMove(QMouseEvent*)));
connect(ui->customPlot, SIGNAL(mouseRelease(QMouseEvent*)), this, SLOT(mouseRelease(QMouseEvent*)));

//实现恢复1:1功能
connect(ui->pushButton, SIGNAL(clicked()), this, SLOT(slotBtn()));
//鼠标按下槽函数
void MainWindow::mousePress(QMouseEvent* mevent)
{
if(mevent->button() == Qt::RightButton)
{
rubberOrigin = mevent->pos();
rubberBand->setGeometry(QRect(rubberOrigin, QSize()));
rubberBand->show();
}
}//鼠标移动槽函数
void MainWindow::mouseMove(QMouseEvent *mevent)
{
if(rubberBand->isVisible())
rubberBand->setGeometry(QRect(rubberOrigin, mevent->pos()).normalized());
}//鼠标释放槽函数
void MainWindow::mouseRelease(QMouseEvent *mevent)
{
Q_UNUSED(mevent);
if (rubberBand->isVisible())
{
const QRect zoomRect = rubberBand->geometry();
int xp1, yp1, xp2, yp2;
zoomRect.getCoords(&xp1, &yp1, &xp2, &yp2);
double x1 = ui->customPlot->xAxis->pixelToCoord(xp1);
double x2 = ui->customPlot->xAxis->pixelToCoord(xp2);
double y1 = ui->customPlot->yAxis->pixelToCoord(yp1);
double y2 = ui->customPlot->yAxis->pixelToCoord(yp2);
ui->customPlot->xAxis->setRange(x1, x2);
ui->customPlot->yAxis->setRange(y1, y2);
rubberBand->hide();
ui->customPlot->replot();
}
}//槽函数实现1:1恢复功能
void MainWindow::slotBtn()
{
ui->customPlot->rescaleAxes();
ui->customPlot->replot();
}子类化QCustomPlot重载鼠标事件函数方法
我们继承QCustomPlot实现子类CustomPlotZoom类。
CustomPlotZoom.h头文件
#ifndef CUSTOMPLOTZOOM_H
#define CUSTOMPLOTZOOM_H

#include <QPoint>
#include "qcustomplot.h"

class QRubberBand;
class QMouseEvent;
class QWidget;

class CustomPlotZoom : public QCustomPlot
{
    Q_OBJECT

public:
    CustomPlotZoom(QWidget * parent = 0);
    virtual ~CustomPlotZoom();

    void setZoomMode(bool mode);

protected:
    void mousePressEvent(QMouseEvent * event);
    void mouseMoveEvent(QMouseEvent * event);
    void mouseReleaseEvent(QMouseEvent * event);

private:
    bool mZoomMode;
    QRubberBand * mRubberBand;
    QPoint mOrigin;
};


#endif // CUSTOMPLOTZOOM_H
CustomPlotZoom构造函数实现
CustomPlotZoom::CustomPlotZoom(QWidget * parent)
    : QCustomPlot(parent)
    , mZoomMode(false)
    , mRubberBand(new QRubberBand(QRubberBand::Rectangle, this))
{}
设置矩形缩放功能的使能
void CustomPlotZoom::setZoomMode(bool mode)
{
    mZoomMode = mode;
}
鼠标事件的实现
void CustomPlotZoom::mousePressEvent(QMouseEvent * event)
{
    if (mZoomMode)
    {
        if (event->button() == Qt::RightButton)
        {
            mOrigin = event->pos();
            mRubberBand->setGeometry(QRect(mOrigin, QSize()));
            mRubberBand->show();
        }
    }
    QCustomPlot::mousePressEvent(event);
}

void CustomPlotZoom::mouseMoveEvent(QMouseEvent * event)
{
    if (mRubberBand->isVisible())
    {
        mRubberBand->setGeometry(QRect(mOrigin, event->pos()).normalized());
    }
    QCustomPlot::mouseMoveEvent(event);
}

void CustomPlotZoom::mouseReleaseEvent(QMouseEvent * event)
{
    if (mRubberBand->isVisible())
    {
        const QRect zoomRect = mRubberBand->geometry();
        int xp1, yp1, xp2, yp2;
        zoomRect.getCoords(&xp1, &yp1, &xp2, &yp2);
        double x1 = xAxis->pixelToCoord(xp1);
        double x2 = xAxis->pixelToCoord(xp2);
        double y1 = yAxis->pixelToCoord(yp1);
        double y2 = yAxis->pixelToCoord(yp2);

        xAxis->setRange(x1, x2);
        yAxis->setRange(y1, y2);

        mRubberBand->hide();
        replot();
    }
    QCustomPlot::mouseReleaseEvent(event);
}
结果
右键来实现选择矩形区域,因为QCustomPlot左键实现了拖拽功能。
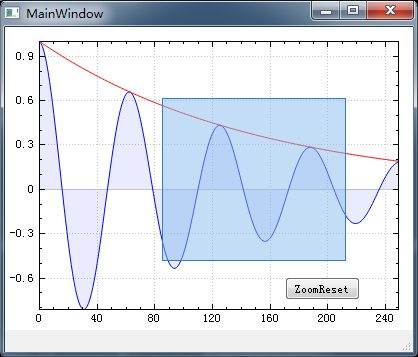
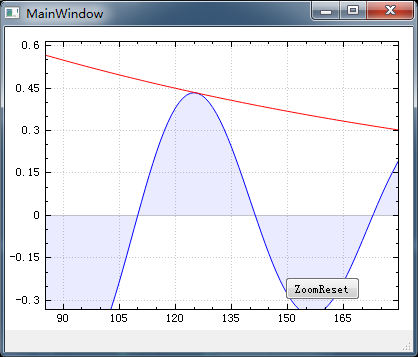
然后可以随便缩放,拖拽。然后点击ZoomReset按钮,就可以实现一键恢复到最初的样子,做到不忘初心。