1. 先把zabbix_agent监控脚本贴上来:
cat nginx_status.sh
#!/bin/bash

NGINX_PORT=8000
NGINX_COMMAND=$1

case $NGINX_COMMAND in
    connect)
        if $(/usr/bin/which pidof) -s nginx &>/dev/null;then
            echo "0"
        else
            echo "1"
        fi
    ;;
    active)
        curl -s localhost:8000/nginx_status|grep -i 'Active connections'|awk '{print $NF}'
    ;;
    reading)
        curl -s localhost:8000/nginx_status|grep -i 'reading'|awk '{print $2}'
    ;;
    writing)
        curl -s localhost:8000/nginx_status|grep -i 'Writing'|awk '{print $4}'
    ;;
    waiting)
        curl -s localhost:8000/nginx_status|grep -i 'waiting'|awk '{print $6}'
    ;;
    accepts)
        curl -s localhost:8000/nginx_status|awk 'NR==3{print $1}'
    ;;
    handled)
        curl -s localhost:8000/nginx_status|awk 'NR==3{print $2}'
    ;;
    requests)
        curl -s localhost:8000/nginx_status|awk 'NR==3{print $3}'
    ;;
    *)
        echo "USAGE: $0 {active|reading|writing|waiting|accepts|handled|requests}"
esac

# Active connections
#   当前活动客户端连接数,包括Waiting连接数。
# accepts
#   已接受的客户端连接总数。
# handled
#   处理的连接总数。通常,参数值与accepts 除非已达到某些资源限制(例如: worker_connections限制)相同。
# requests
#   客户端请求的总数。
# Reading
#   nginx正在读取请求标头的当前连接数。
# Writing
#   nginx将响应写回客户端的当前连接数。
# Waiting
#   当前等待请求的空闲客户端连接数(开启keep-alive的情况下,这个值等于 Active - (Reading+Writing))
2. 编辑zabbix_agentd.conf文件
# UserParameter= # 找到这一行在下面添加自定义key
UserParameter=nginx_status[*],/bin/bash /home/changchun/scripts/nginx_status.sh $1
# zabbix_server端可通过zabbix_get测试: zabbix -s agent_ip -p10050 -k "nginx_status[connect]"
3.创建模板


4.添加监控项
a)找到刚才新建的模板--->选择监控项

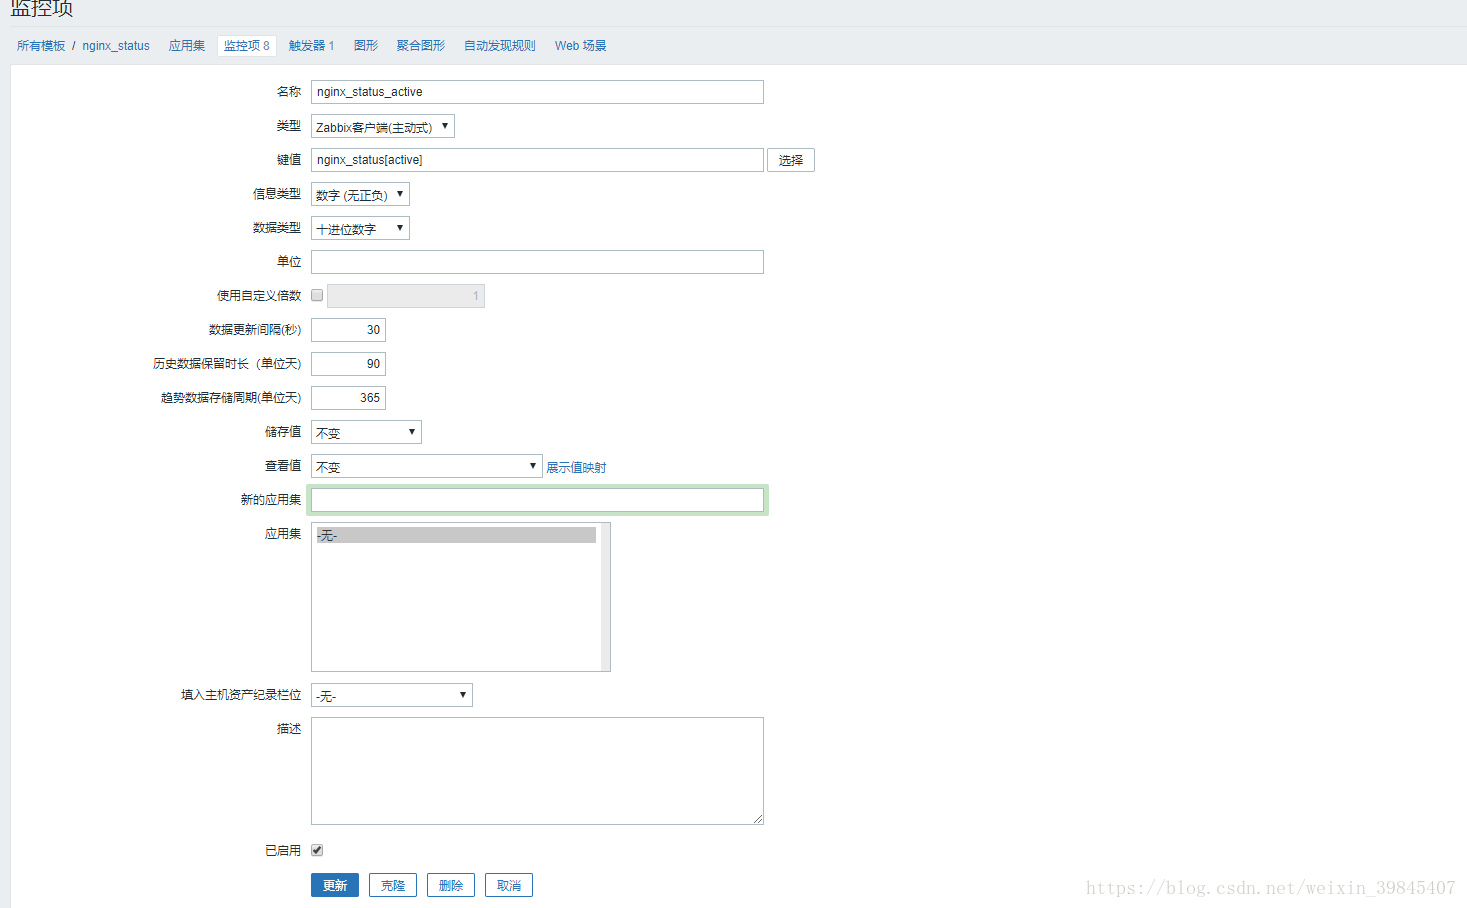
b)创建监控项

c)取active为例,其他相同配置即可(因为我是配置的agent主动模式,所以配置的主动模式,想了解的可以参考我之前的文章)
5.添加触发器,选择模板--->触发器

a)创建触发器

b)这里的触发器为了,监控nginx_connect的

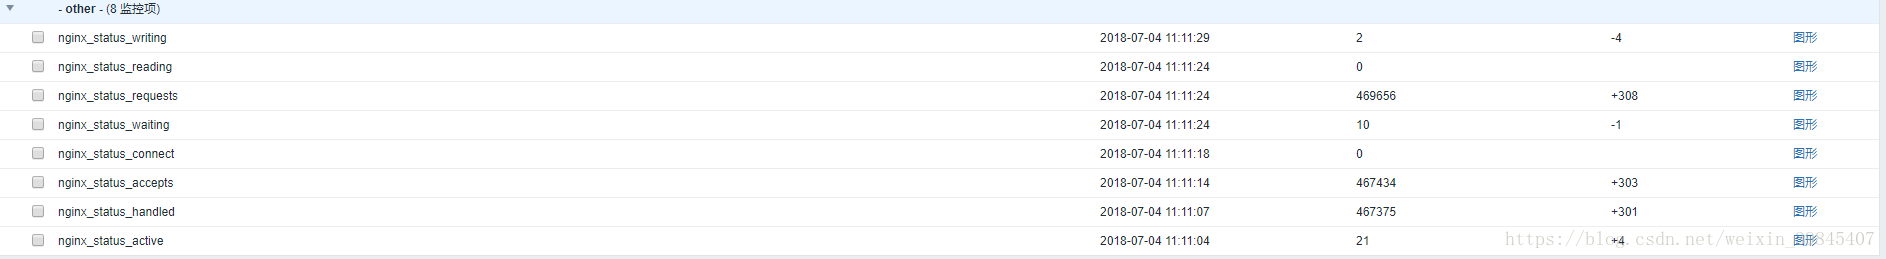
c)接下来就可以在最新数据中看到结果了

# 因为这边是线上环境,就不进行测试了,自己感兴趣的话则使用虚拟机进行测试吧