nginx的stub_status模块
location =/status {
         stub_status;
        }

[root@localhost ~]# curl 192.168.179.104/status 2>/dev/null
Active connections: 1
server accepts handled requests
 21 21 21
Reading: 0 Writing: 1 Waiting: 0

Active connections: 活跃的连接数量

Server accepts handled requests: Nginx总共处理了21个连接,成功创建21次握手(证明中间没有失败的),总共处理了21个请求.

Reading: Nginx 读取到客户端的Header信息数.
Writing: Nginx 返回给客户端的Header信息数.

Waiting: 开启keep-alive的情况下,这个值等于 active – (reading + writing),意思就是Nginx已经处理完成,正在等候下一次请求指令的驻留连接.
所以,在访问效率高,请求很快被处理完毕的情况下,Waiting数比较多是正常的.如果reading +writing数较多,则说明并发访问量非常大,正在处理过程中.
使用zabbix来监控nginx的stub_status模块给我们提供的信息(不要监控太频繁,定时或者几个小时监控一次,监控太频繁会给nginx带来压力)
[root@localhost sh]# chmod o+x nginx_status.sh
[root@localhost sh]# chmod u+s nginx_status.sh
#这个脚本是让zabbix来调用获取到nginx状态
[root@localhost sh]# cat nginx_status.sh
#!/bin/bash
function active(){
curl 192.168.179.104/status 2>/dev/null | awk 'NR==1 {print $NF}'
}
function accepts(){
curl 192.168.179.104/status 2>/dev/null | awk 'NR==3 {print $1}'
}
function handled(){
curl 192.168.179.104/status 2>/dev/null | awk 'NR==3 {print $2}'
}
function requests(){
curl 192.168.179.104/status 2>/dev/null | awk 'NR==3 {print $3}'
}
function reading(){
curl 192.168.179.104/status 2>/dev/null | awk 'NR==4{print $2}'
}
function writing(){
curl 192.168.179.104/status 2>/dev/null | awk 'NR==4 {print $4}'
}
function waiting(){
curl 192.168.179.104/status 2>/dev/null | awk 'NR==4 {print $NF}'
}
$1
#zabbix agent自定义key值,通过上面的脚本来获取到nginx的状态
[root@localhost ~]# vim /etc/zabbix_agentd.conf
UserParameter=nginx.status[*],/usr/bin/bash /data/sh/nginx_status.sh $1
[root@localhost ~]# systemctl restart zabbix-agent
#zabbix-agent端执行脚本
[root@localhost sh]# bash nginx_status.sh accepts
19
[root@localhost sh]# bash nginx_status.sh handled
20
#zabbix-server 端获取key值
[root@localhost ~]# zabbix_get -s 192.168.179.104 -k nginx.status[requests]
26
[root@localhost ~]# zabbix_get -s 192.168.179.104 -k nginx.status[active]
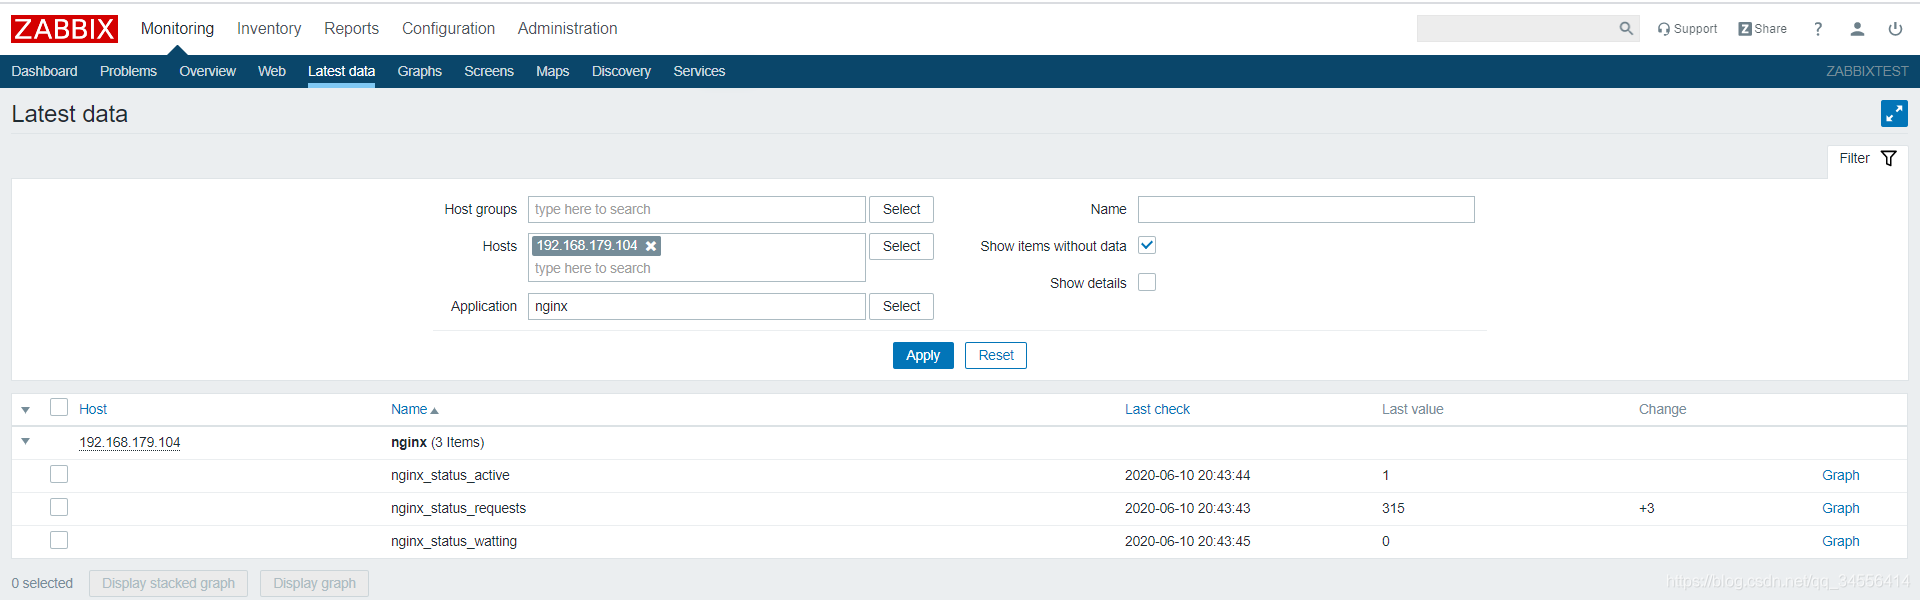
1在zabbix里面配置以上自定义的item监控项
添加key为nginx.status[waiting] ,这里的update interval可以设置常一点,不要频繁的访问nginx拿key值

添加key为nginx.status[requests]
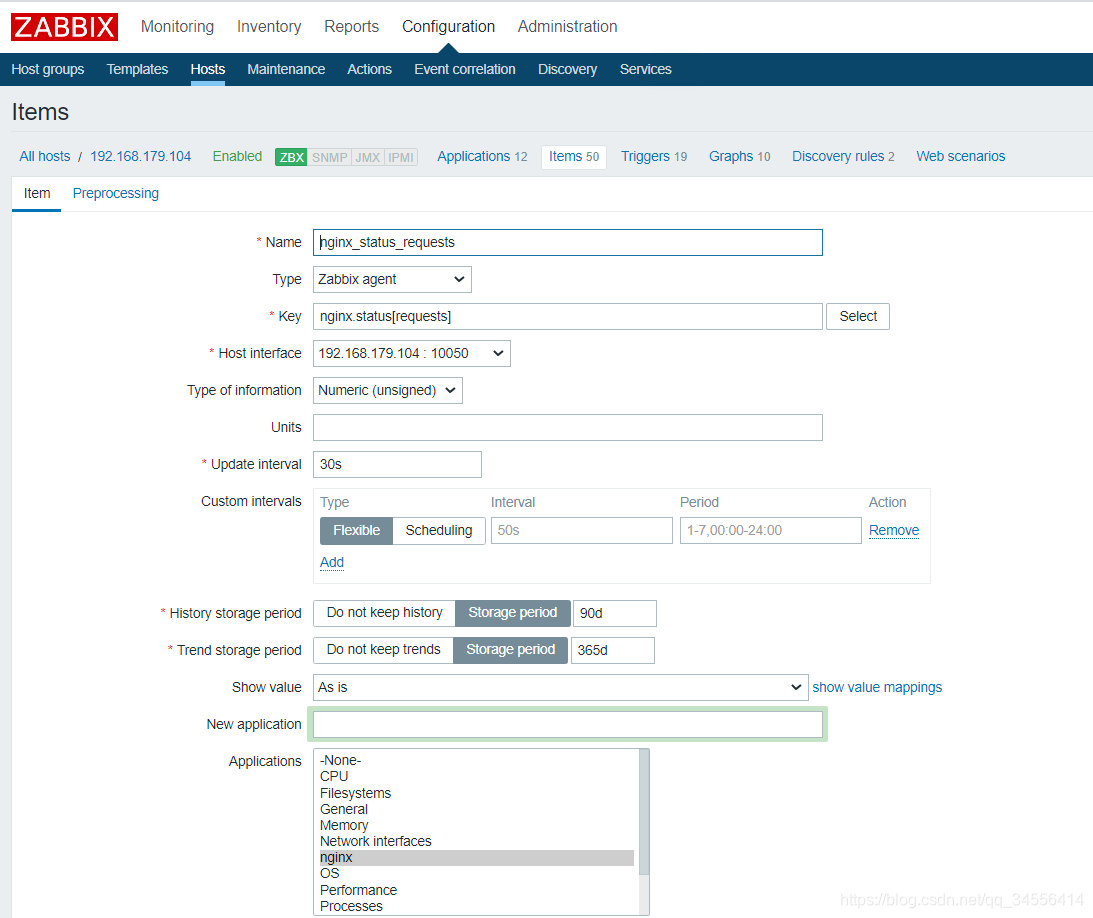
添加key为nginx.status[active]

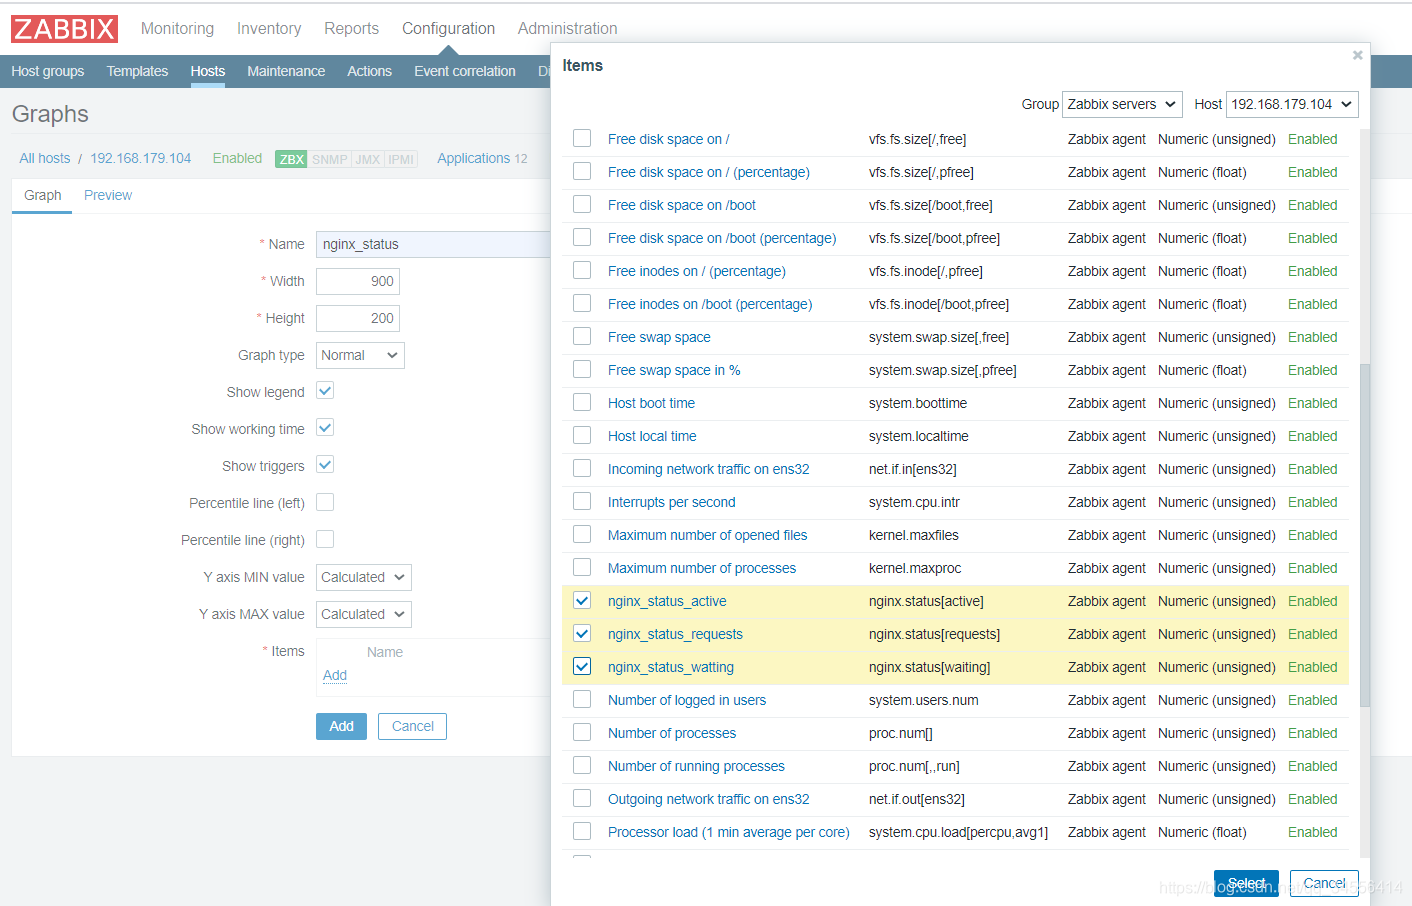
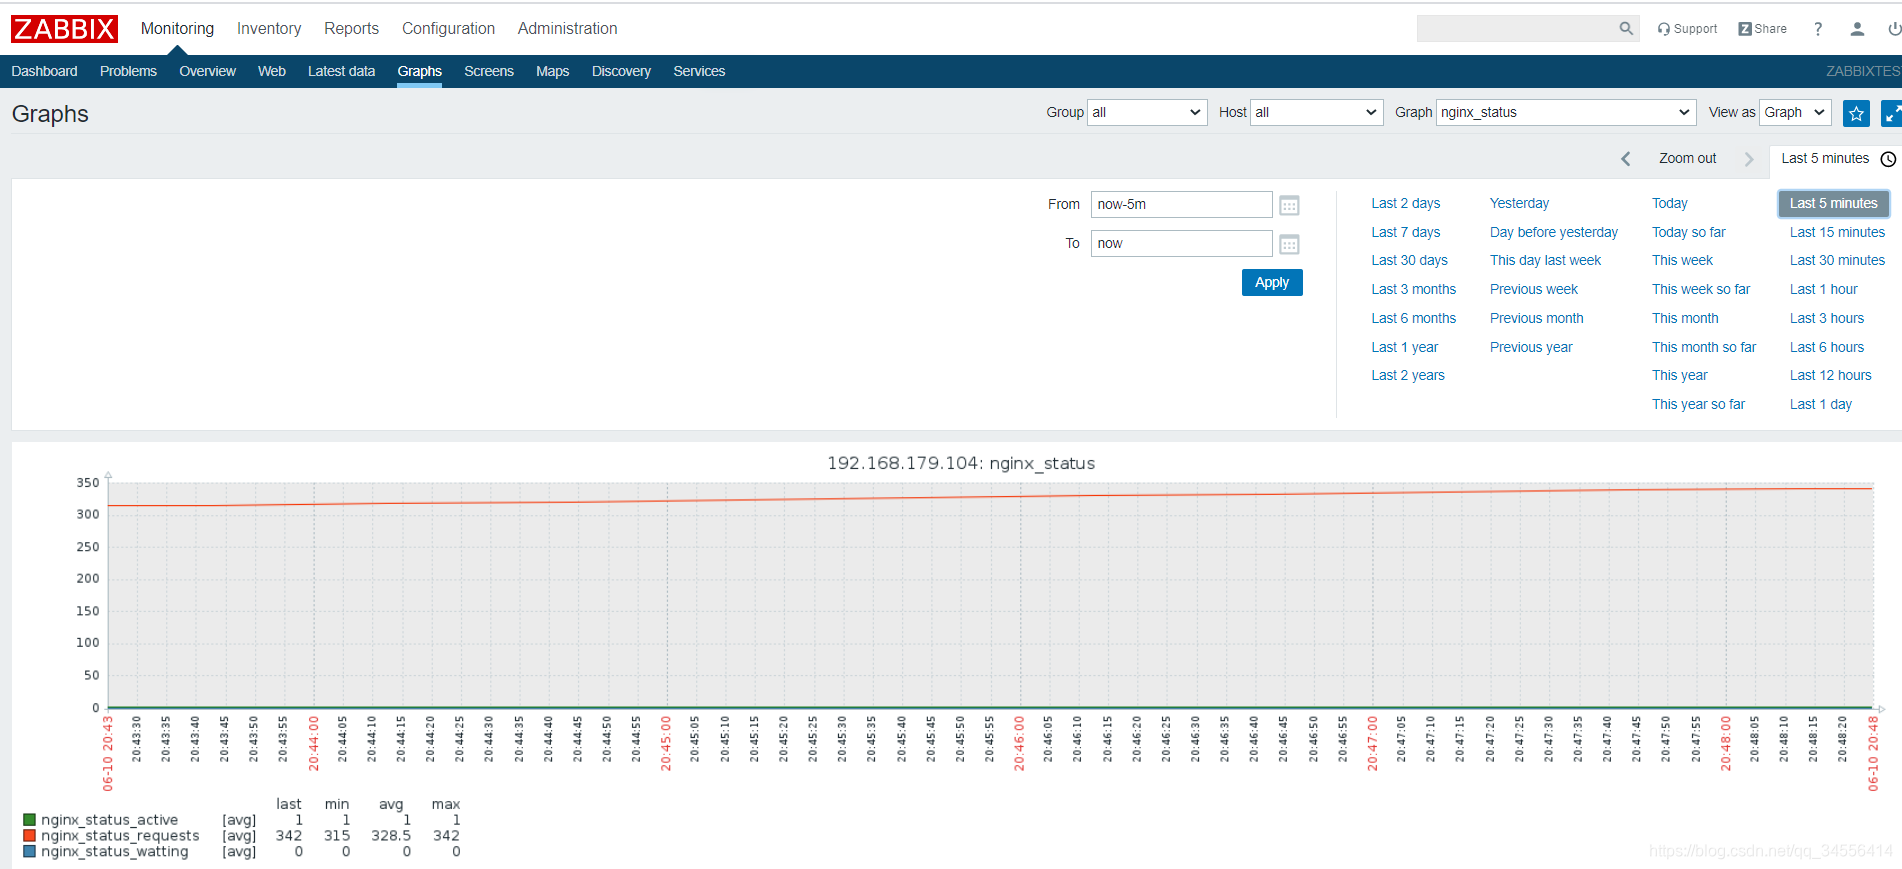
剩下的照葫芦画瓢,不一一展示


创建graph将上面item图像合并在一起

#如果你希望你的脚本美观一些不是那么多函数可以如下,一次性获取所有的值:
#!/bin/sh
values=`curl 192.168.179.104/status  2>/dev/null | awk 'NR==1 {print $NF};NR==3 {print $1,$2,$3};NR==4 {print $2,$4,$NF}'`

case $1 in
active)
	echo `echo $values | awk '{print $1}'`
	;;
accept)
	echo `echo $values | awk '{print $2}'`
	;;
handled)
	echo `echo $values | awk '{print $3}'`
	;;
esac


[root@localhost sh]# ./nginx_status.sh  active
1
[root@localhost sh]# ./nginx_status.sh  accept
1155