第一步:导入相应的库
import tushare as ts
import matplotlib.pyplot as plt
import numpy as np
第二步:导入mpl_finance.py脚本文件
import mpl_finance as mpf其中,mpl_finance.py脚本文件如下:
"""
A collection of functions for analyzing and plotting
financial data. User contributions welcome!
"""
from __future__ import (absolute_import, division, print_function,
unicode_literals)
import numpy as np
from matplotlib import colors as mcolors
from matplotlib.collections import LineCollection, PolyCollection
from matplotlib.lines import TICKLEFT, TICKRIGHT, Line2D
from matplotlib.patches import Rectangle
from matplotlib.transforms import Affine2D
from six.moves import xrange, zip
def plot_day_summary_oclh(ax, quotes, ticksize=3,
colorup='k', colordown='r'):
"""Plots day summary
Represent the time, open, close, high, low as a vertical line
ranging from low to high. The left tick is the open and the right
tick is the close.
Parameters
----------
ax : `Axes`
an `Axes` instance to plot to
quotes : sequence of (time, open, close, high, low, ...) sequences
data to plot. time must be in float date format - see date2num
ticksize : int
open/close tick marker in points
colorup : color
the color of the lines where close >= open
colordown : color
the color of the lines where close < open
Returns
-------
lines : list
list of tuples of the lines added (one tuple per quote)
"""
return _plot_day_summary(ax, quotes, ticksize=ticksize,
colorup=colorup, colordown=colordown,
ochl=True)
def plot_day_summary_ohlc(ax, quotes, ticksize=3,
colorup='k', colordown='r'):
"""Plots day summary
Represent the time, open, high, low, close as a vertical line
ranging from low to high. The left tick is the open and the right
tick is the close.
Parameters
----------
ax : `Axes`
an `Axes` instance to plot to
quotes : sequence of (time, open, high, low, close, ...) sequences
data to plot. time must be in float date format - see date2num
ticksize : int
open/close tick marker in points
colorup : color
the color of the lines where close >= open
colordown : color
the color of the lines where close < open
Returns
-------
lines : list
list of tuples of the lines added (one tuple per quote)
"""
return _plot_day_summary(ax, quotes, ticksize=ticksize,
colorup=colorup, colordown=colordown,
ochl=False)
def _plot_day_summary(ax, quotes, ticksize=3,
colorup='k', colordown='r',
ochl=True):
"""Plots day summary
Represent the time, open, high, low, close as a vertical line
ranging from low to high. The left tick is the open and the right
tick is the close.
Parameters
----------
ax : `Axes`
an `Axes` instance to plot to
quotes : sequence of quote sequences
data to plot. time must be in float date format - see date2num
(time, open, high, low, close, ...) vs
(time, open, close, high, low, ...)
set by `ochl`
ticksize : int
open/close tick marker in points
colorup : color
the color of the lines where close >= open
colordown : color
the color of the lines where close < open
ochl: bool
argument to select between ochl and ohlc ordering of quotes
Returns
-------
lines : list
list of tuples of the lines added (one tuple per quote)
"""
# unfortunately this has a different return type than plot_day_summary2_*
lines = []
for q in quotes:
if ochl:
t, open, close, high, low = q[:5]
else:
t, open, high, low, close = q[:5]
if close >= open:
color = colorup
else:
color = colordown
vline = Line2D(xdata=(t, t), ydata=(low, high),
color=color,
antialiased=False, # no need to antialias vert lines
)
oline = Line2D(xdata=(t, t), ydata=(open, open),
color=color,
antialiased=False,
marker=TICKLEFT,
markersize=ticksize,
)
cline = Line2D(xdata=(t, t), ydata=(close, close),
color=color,
antialiased=False,
markersize=ticksize,
marker=TICKRIGHT)
lines.extend((vline, oline, cline))
ax.add_line(vline)
ax.add_line(oline)
ax.add_line(cline)
ax.autoscale_view()
return lines
def candlestick_ochl(ax, quotes, width=0.2, colorup='k', colordown='r',
alpha=1.0):
"""
Plot the time, open, close, high, low as a vertical line ranging
from low to high. Use a rectangular bar to represent the
open-close span. If close >= open, use colorup to color the bar,
otherwise use colordown
Parameters
----------
ax : `Axes`
an Axes instance to plot to
quotes : sequence of (time, open, close, high, low, ...) sequences
As long as the first 5 elements are these values,
the record can be as long as you want (e.g., it may store volume).
time must be in float days format - see date2num
width : float
fraction of a day for the rectangle width
colorup : color
the color of the rectangle where close >= open
colordown : color
the color of the rectangle where close < open
alpha : float
the rectangle alpha level
Returns
-------
ret : tuple
returns (lines, patches) where lines is a list of lines
added and patches is a list of the rectangle patches added
"""
return _candlestick(ax, quotes, width=width, colorup=colorup,
colordown=colordown,
alpha=alpha, ochl=True)
def candlestick_ohlc(ax, quotes, width=0.2, colorup='k', colordown='r',
alpha=1.0):
"""
Plot the time, open, high, low, close as a vertical line ranging
from low to high. Use a rectangular bar to represent the
open-close span. If close >= open, use colorup to color the bar,
otherwise use colordown
Parameters
----------
ax : `Axes`
an Axes instance to plot to
quotes : sequence of (time, open, high, low, close, ...) sequences
As long as the first 5 elements are these values,
the record can be as long as you want (e.g., it may store volume).
time must be in float days format - see date2num
width : float
fraction of a day for the rectangle width
colorup : color
the color of the rectangle where close >= open
colordown : color
the color of the rectangle where close < open
alpha : float
the rectangle alpha level
Returns
-------
ret : tuple
returns (lines, patches) where lines is a list of lines
added and patches is a list of the rectangle patches added
"""
return _candlestick(ax, quotes, width=width, colorup=colorup,
colordown=colordown,
alpha=alpha, ochl=False)
def _candlestick(ax, quotes, width=0.2, colorup='k', colordown='r',
alpha=1.0, ochl=True):
"""
Plot the time, open, high, low, close as a vertical line ranging
from low to high. Use a rectangular bar to represent the
open-close span. If close >= open, use colorup to color the bar,
otherwise use colordown
Parameters
----------
ax : `Axes`
an Axes instance to plot to
quotes : sequence of quote sequences
data to plot. time must be in float date format - see date2num
(time, open, high, low, close, ...) vs
(time, open, close, high, low, ...)
set by `ochl`
width : float
fraction of a day for the rectangle width
colorup : color
the color of the rectangle where close >= open
colordown : color
the color of the rectangle where close < open
alpha : float
the rectangle alpha level
ochl: bool
argument to select between ochl and ohlc ordering of quotes
Returns
-------
ret : tuple
returns (lines, patches) where lines is a list of lines
added and patches is a list of the rectangle patches added
"""
OFFSET = width / 2.0
lines = []
patches = []
for q in quotes:
if ochl:
t, open, close, high, low = q[:5]
else:
t, open, high, low, close = q[:5]
if close >= open:
color = colorup
lower = open
height = close - open
else:
color = colordown
lower = close
height = open - close
vline = Line2D(
xdata=(t, t), ydata=(low, high),
color=color,
linewidth=0.5,
antialiased=True,
)
rect = Rectangle(
xy=(t - OFFSET, lower),
width=width,
height=height,
facecolor=color,
edgecolor=color,
)
rect.set_alpha(alpha)
lines.append(vline)
patches.append(rect)
ax.add_line(vline)
ax.add_patch(rect)
ax.autoscale_view()
return lines, patches
def _check_input(opens, closes, highs, lows, miss=-1):
"""Checks that *opens*, *highs*, *lows* and *closes* have the same length.
NOTE: this code assumes if any value open, high, low, close is
missing (*-1*) they all are missing
Parameters
----------
ax : `Axes`
an Axes instance to plot to
opens : sequence
sequence of opening values
highs : sequence
sequence of high values
lows : sequence
sequence of low values
closes : sequence
sequence of closing values
miss : int
identifier of the missing data
Raises
------
ValueError
if the input sequences don't have the same length
"""
def _missing(sequence, miss=-1):
"""Returns the index in *sequence* of the missing data, identified by
*miss*
Parameters
----------
sequence :
sequence to evaluate
miss :
identifier of the missing data
Returns
-------
where_miss: numpy.ndarray
indices of the missing data
"""
return np.where(np.array(sequence) == miss)[0]
same_length = len(opens) == len(highs) == len(lows) == len(closes)
_missopens = _missing(opens)
same_missing = ((_missopens == _missing(highs)).all() and
(_missopens == _missing(lows)).all() and
(_missopens == _missing(closes)).all())
if not (same_length and same_missing):
msg = ("*opens*, *highs*, *lows* and *closes* must have the same"
" length. NOTE: this code assumes if any value open, high,"
" low, close is missing (*-1*) they all must be missing.")
raise ValueError(msg)
def plot_day_summary2_ochl(ax, opens, closes, highs, lows, ticksize=4,
colorup='k', colordown='r'):
"""Represent the time, open, close, high, low, as a vertical line
ranging from low to high. The left tick is the open and the right
tick is the close.
Parameters
----------
ax : `Axes`
an Axes instance to plot to
opens : sequence
sequence of opening values
closes : sequence
sequence of closing values
highs : sequence
sequence of high values
lows : sequence
sequence of low values
ticksize : int
size of open and close ticks in points
colorup : color
the color of the lines where close >= open
colordown : color
the color of the lines where close < open
Returns
-------
ret : list
a list of lines added to the axes
"""
return plot_day_summary2_ohlc(ax, opens, highs, lows, closes, ticksize,
colorup, colordown)
def plot_day_summary2_ohlc(ax, opens, highs, lows, closes, ticksize=4,
colorup='k', colordown='r'):
"""Represent the time, open, high, low, close as a vertical line
ranging from low to high. The left tick is the open and the right
tick is the close.
*opens*, *highs*, *lows* and *closes* must have the same length.
NOTE: this code assumes if any value open, high, low, close is
missing (*-1*) they all are missing
Parameters
----------
ax : `Axes`
an Axes instance to plot to
opens : sequence
sequence of opening values
highs : sequence
sequence of high values
lows : sequence
sequence of low values
closes : sequence
sequence of closing values
ticksize : int
size of open and close ticks in points
colorup : color
the color of the lines where close >= open
colordown : color
the color of the lines where close < open
Returns
-------
ret : list
a list of lines added to the axes
"""
_check_input(opens, highs, lows, closes)
rangeSegments = [((i, low), (i, high)) for i, low, high in
zip(xrange(len(lows)), lows, highs) if low != -1]
# the ticks will be from ticksize to 0 in points at the origin and
# we'll translate these to the i, close location
openSegments = [((-ticksize, 0), (0, 0))]
# the ticks will be from 0 to ticksize in points at the origin and
# we'll translate these to the i, close location
closeSegments = [((0, 0), (ticksize, 0))]
offsetsOpen = [(i, open) for i, open in
zip(xrange(len(opens)), opens) if open != -1]
offsetsClose = [(i, close) for i, close in
zip(xrange(len(closes)), closes) if close != -1]
scale = ax.figure.dpi * (1.0 / 72.0)
tickTransform = Affine2D().scale(scale, 0.0)
colorup = mcolors.to_rgba(colorup)
colordown = mcolors.to_rgba(colordown)
colord = {True: colorup, False: colordown}
colors = [colord[open < close] for open, close in
zip(opens, closes) if open != -1 and close != -1]
useAA = 0, # use tuple here
lw = 1, # and here
rangeCollection = LineCollection(rangeSegments,
colors=colors,
linewidths=lw,
antialiaseds=useAA,
)
openCollection = LineCollection(openSegments,
colors=colors,
antialiaseds=useAA,
linewidths=lw,
offsets=offsetsOpen,
transOffset=ax.transData,
)
openCollection.set_transform(tickTransform)
closeCollection = LineCollection(closeSegments,
colors=colors,
antialiaseds=useAA,
linewidths=lw,
offsets=offsetsClose,
transOffset=ax.transData,
)
closeCollection.set_transform(tickTransform)
minpy, maxx = (0, len(rangeSegments))
miny = min([low for low in lows if low != -1])
maxy = max([high for high in highs if high != -1])
corners = (minpy, miny), (maxx, maxy)
ax.update_datalim(corners)
ax.autoscale_view()
# add these last
ax.add_collection(rangeCollection)
ax.add_collection(openCollection)
ax.add_collection(closeCollection)
return rangeCollection, openCollection, closeCollection
def candlestick2_ochl(ax, opens, closes, highs, lows, width=4,
colorup='k', colordown='r',
alpha=0.75):
"""Represent the open, close as a bar line and high low range as a
vertical line.
Preserves the original argument order.
Parameters
----------
ax : `Axes`
an Axes instance to plot to
opens : sequence
sequence of opening values
closes : sequence
sequence of closing values
highs : sequence
sequence of high values
lows : sequence
sequence of low values
width : int
size of open and close ticks in points
colorup : color
the color of the lines where close >= open
colordown : color
the color of the lines where close < open
alpha : float
bar transparency
Returns
-------
ret : tuple
(lineCollection, barCollection)
"""
return candlestick2_ohlc(ax, opens, highs, lows, closes, width=width,
colorup=colorup, colordown=colordown,
alpha=alpha)
def candlestick2_ohlc(ax, opens, highs, lows, closes, width=4,
colorup='k', colordown='r',
alpha=0.75):
"""Represent the open, close as a bar line and high low range as a
vertical line.
NOTE: this code assumes if any value open, low, high, close is
missing they all are missing
Parameters
----------
ax : `Axes`
an Axes instance to plot to
opens : sequence
sequence of opening values
highs : sequence
sequence of high values
lows : sequence
sequence of low values
closes : sequence
sequence of closing values
width : int
size of open and close ticks in points
colorup : color
the color of the lines where close >= open
colordown : color
the color of the lines where close < open
alpha : float
bar transparency
Returns
-------
ret : tuple
(lineCollection, barCollection)
"""
_check_input(opens, highs, lows, closes)
delta = width / 2.
barVerts = [((i - delta, open),
(i - delta, close),
(i + delta, close),
(i + delta, open))
for i, open, close in zip(xrange(len(opens)), opens, closes)
if open != -1 and close != -1]
rangeSegments = [((i, low), (i, high))
for i, low, high in zip(xrange(len(lows)), lows, highs)
if low != -1]
colorup = mcolors.to_rgba(colorup, alpha)
colordown = mcolors.to_rgba(colordown, alpha)
colord = {True: colorup, False: colordown}
colors = [colord[open < close]
for open, close in zip(opens, closes)
if open != -1 and close != -1]
useAA = 0, # use tuple here
lw = 0.5, # and here
rangeCollection = LineCollection(rangeSegments,
colors=colors,
linewidths=lw,
antialiaseds=useAA,
)
barCollection = PolyCollection(barVerts,
facecolors=colors,
edgecolors=colors,
antialiaseds=useAA,
linewidths=lw,
)
minx, maxx = 0, len(rangeSegments)
miny = min([low for low in lows if low != -1])
maxy = max([high for high in highs if high != -1])
corners = (minx, miny), (maxx, maxy)
ax.update_datalim(corners)
ax.autoscale_view()
# add these last
ax.add_collection(rangeCollection)
ax.add_collection(barCollection)
return rangeCollection, barCollection
def volume_overlay(ax, opens, closes, volumes,
colorup='k', colordown='r',
width=4, alpha=1.0):
"""Add a volume overlay to the current axes. The opens and closes
are used to determine the color of the bar. -1 is missing. If a
value is missing on one it must be missing on all
Parameters
----------
ax : `Axes`
an Axes instance to plot to
opens : sequence
a sequence of opens
closes : sequence
a sequence of closes
volumes : sequence
a sequence of volumes
width : int
the bar width in points
colorup : color
the color of the lines where close >= open
colordown : color
the color of the lines where close < open
alpha : float
bar transparency
Returns
-------
ret : `barCollection`
The `barrCollection` added to the axes
"""
colorup = mcolors.to_rgba(colorup, alpha)
colordown = mcolors.to_rgba(colordown, alpha)
colord = {True: colorup, False: colordown}
colors = [colord[open < close]
for open, close in zip(opens, closes)
if open != -1 and close != -1]
delta = width / 2.
bars = [((i - delta, 0), (i - delta, v), (i + delta, v), (i + delta, 0))
for i, v in enumerate(volumes)
if v != -1]
barCollection = PolyCollection(bars,
facecolors=colors,
edgecolors=((0, 0, 0, 1), ),
antialiaseds=(0,),
linewidths=(0.5,),
)
ax.add_collection(barCollection)
corners = (0, 0), (len(bars), max(volumes))
ax.update_datalim(corners)
ax.autoscale_view()
# add these last
return barCollection
def volume_overlay2(ax, closes, volumes,
colorup='k', colordown='r',
width=4, alpha=1.0):
"""
Add a volume overlay to the current axes. The closes are used to
determine the color of the bar. -1 is missing. If a value is
missing on one it must be missing on all
nb: first point is not displayed - it is used only for choosing the
right color
Parameters
----------
ax : `Axes`
an Axes instance to plot to
closes : sequence
a sequence of closes
volumes : sequence
a sequence of volumes
width : int
the bar width in points
colorup : color
the color of the lines where close >= open
colordown : color
the color of the lines where close < open
alpha : float
bar transparency
Returns
-------
ret : `barCollection`
The `barrCollection` added to the axes
"""
return volume_overlay(ax, closes[:-1], closes[1:], volumes[1:],
colorup, colordown, width, alpha)
def volume_overlay3(ax, quotes,
colorup='k', colordown='r',
width=4, alpha=1.0):
"""Add a volume overlay to the current axes. quotes is a list of (d,
open, high, low, close, volume) and close-open is used to
determine the color of the bar
Parameters
----------
ax : `Axes`
an Axes instance to plot to
quotes : sequence of (time, open, high, low, close, ...) sequences
data to plot. time must be in float date format - see date2num
width : int
the bar width in points
colorup : color
the color of the lines where close1 >= close0
colordown : color
the color of the lines where close1 < close0
alpha : float
bar transparency
Returns
-------
ret : `barCollection`
The `barrCollection` added to the axes
"""
colorup = mcolors.to_rgba(colorup, alpha)
colordown = mcolors.to_rgba(colordown, alpha)
colord = {True: colorup, False: colordown}
dates, opens, highs, lows, closes, volumes = list(zip(*quotes))
colors = [colord[close1 >= close0]
for close0, close1 in zip(closes[:-1], closes[1:])
if close0 != -1 and close1 != -1]
colors.insert(0, colord[closes[0] >= opens[0]])
right = width / 2.0
left = -width / 2.0
bars = [((left, 0), (left, volume), (right, volume), (right, 0))
for d, open, high, low, close, volume in quotes]
sx = ax.figure.dpi * (1.0 / 72.0) # scale for points
sy = ax.bbox.height / ax.viewLim.height
barTransform = Affine2D().scale(sx, sy)
dates = [d for d, open, high, low, close, volume in quotes]
offsetsBars = [(d, 0) for d in dates]
useAA = 0, # use tuple here
lw = 0.5, # and here
barCollection = PolyCollection(bars,
facecolors=colors,
edgecolors=((0, 0, 0, 1),),
antialiaseds=useAA,
linewidths=lw,
offsets=offsetsBars,
transOffset=ax.transData,
)
barCollection.set_transform(barTransform)
minpy, maxx = (min(dates), max(dates))
miny = 0
maxy = max([volume for d, open, high, low, close, volume in quotes])
corners = (minpy, miny), (maxx, maxy)
ax.update_datalim(corners)
# print 'datalim', ax.dataLim.bounds
# print 'viewlim', ax.viewLim.bounds
ax.add_collection(barCollection)
ax.autoscale_view()
return barCollection
def index_bar(ax, vals,
facecolor='b', edgecolor='l',
width=4, alpha=1.0, ):
"""Add a bar collection graph with height vals (-1 is missing).
Parameters
----------
ax : `Axes`
an Axes instance to plot to
vals : sequence
a sequence of values
facecolor : color
the color of the bar face
edgecolor : color
the color of the bar edges
width : int
the bar width in points
alpha : float
bar transparency
Returns
-------
ret : `barCollection`
The `barrCollection` added to the axes
"""
facecolors = (mcolors.to_rgba(facecolor, alpha),)
edgecolors = (mcolors.to_rgba(edgecolor, alpha),)
right = width / 2.0
left = -width / 2.0
bars = [((left, 0), (left, v), (right, v), (right, 0))
for v in vals if v != -1]
sx = ax.figure.dpi * (1.0 / 72.0) # scale for points
sy = ax.bbox.height / ax.viewLim.height
barTransform = Affine2D().scale(sx, sy)
offsetsBars = [(i, 0) for i, v in enumerate(vals) if v != -1]
barCollection = PolyCollection(bars,
facecolors=facecolors,
edgecolors=edgecolors,
antialiaseds=(0,),
linewidths=(0.5,),
offsets=offsetsBars,
transOffset=ax.transData,
)
barCollection.set_transform(barTransform)
minpy, maxx = (0, len(offsetsBars))
miny = 0
maxy = max([v for v in vals if v != -1])
corners = (minpy, miny), (maxx, maxy)
ax.update_datalim(corners)
ax.autoscale_view()
# add these last
ax.add_collection(barCollection)
return barCollection
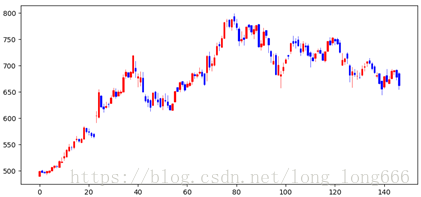
第三步:运行以下代码:
import tushare as ts
import matplotlib.pyplot as plt
import mpl_finance as mpf
import numpy as np
data = ts.get_k_data('600519', ktype='D', autype='qfq', start='2017-09-17', end='')
prices = data[['open', 'high', 'low', 'close']]
dates = data['date']
candleData = np.column_stack([list(range(len(dates))), prices])
fig = plt.figure(figsize=(10, 6))
ax = fig.add_axes([0.1, 0.3, 0.8, 0.6])
mpf.candlestick_ohlc(ax, candleData, width=0.5, colorup='r', colordown='b')
plt.show()
第四步:运行结果