Logstash部分
Logstash
Input filter output
ES
Kibana
logstash是什么
logstash是一个数据采集、加工处理以及传输的工具
logstash特点:
所有类型的数据集中处理
不同模式和格式数据的正常化
自定义数据源轻松添加插件
lostash安装
Logstash 依赖java环境,需要安装java-1.8.0-openjdk
Logstash没有默认的配置文件,需要手动配置
logstash 安装在 /opt/logstash 目录下
rpm -ivh logstash-2.3.4-1.noarch.rpm
logstash插件:
[root@logstash logstash]# /opt/logstash/bin/logstash-plugin list
codec类插件
– 常用的插件:plain、json、json_lines、rubydebug、
multiline等
– 我们还使用刚刚的例子,不过这次我们输入 json 数据
– 我们设置输入源的 codec 是 json,在输入的时候选择
rubydebug
codec:编码,可用于所有区域段
logstash-codec-
logstash-filter-
logstash-input-
logstash-output-
[root@logstash logstash]# vim logstash.conf
input{
stdin{} //标准输入
}
filter{
}
output{
stdout{} //标准输出
}
man cat
[root@logstash logstash]# cat
adbd //标准输入
adbd //标准输出
123456
123456
[root@logstash logstash]# /opt/logstash/bin/logstash -f logstash.conf
Settings: Default pipeline workers: 2
Pipeline main started
2018-07-30T06:31:31.562Z logstash //时间戳加主机名标准输入
adbc
2018-07-30T06:31:36.121Z logstash adbc //标准输出
https://github.com/logstash-plugins/logstash-input-file
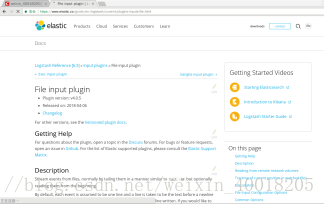
https://www.elastic.co/guide/en/logstash/current/index.html
input{
stdin{ codec => "json" }
}
code编解码:
codec 类插件
– 练习 output 和 input 配置
– 练习 在 input 不指定类型 json 输出结果
– 练习 在 output 不指定 rubydebug 的输出结果
– 同时指定以后的输出结果
[root@logstash logstash]# cat logstash.conf
input{
stdin{ codec => "json" }
}
filter{
}
output{
stdout{ codec => "rubydebug" }
}
[root@logstash logstash]# vim logstash.conf
[root@logstash logstash]# /opt/logstash/bin/logstash -f logstash.conf
Settings: Default pipeline workers: 2
Pipeline main started
abcd
{
"message" => "abcd",
"tags" => [
[0] "_jsonparsefailure"
],
"@version" => "1",
"@timestamp" => "2018-07-30T06:52:58.482Z",
"host" => "logstash"
}
{"a":1,"b":2,"c":3}
{
"a" => 1,
"b" => 2,
"c" => 3,
"@version" => "1",
"@timestamp" => "2018-07-30T06:53:23.702Z",
"host" => "logstash"
}
[root@logstash tmp]# cat /etc/logstash/logstash.conf
input{
stdin{ codec => "json" }
file {
path => [ "/tmp/a.log", "/tmp/b.log" ]
}
}
filter{
}
output{
stdout{ codec => "rubydebug" }
}
[root@logstash logstash]# vim logstash.conf
[root@logstash logstash]# /opt/logstash/bin/logstash -f logstash.conf
Settings: Default pipeline workers: 2
Pipeline main started
{
"message" => "a1",
"@version" => "1",
"@timestamp" => "2018-07-30T07:33:20.167Z",
"path" => "/tmp/a.log",
"host" => "logstash"
}
[root@logstash ~]# cd /tmp
[root@logstash tmp]# echo a1 >> a.log
[root@logstash tmp]# cat /root/.sincedb_ab3977c541d1144f701eedeb3af4956a
613715 0 64769 6
613716 0 64769 3
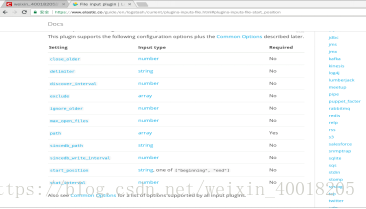
start_positionedit
Value can be any of: beginning, end
Default value is "end"
sincedb_path 记录读取文件的位置
start_position 配置第一次读取文件从什么地方开始
[root@logstash logstash]# cat logstash.conf
input{
stdin{ codec => "json" }
file {
path => [ "/tmp/a.log", "/tmp/b.log" ]
sincedb_path => "/var/lib/logstash/sincedb.log"
start_position => "beginning"
type => "filelog"
}
}
filter{
}
output{
stdout{ codec => "rubydebug" }
}
[root@logstash tmp]# cat /var/lib/logstash/sincedb.log
613715 0 64769 6
613716 0 64769 3
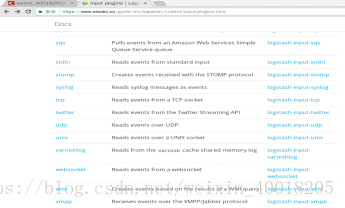
练习 input tcp 和 udp 插件
[root@es5 ~]# man bash
[root@es5 ~]# echo "test udp log" >/dev/udp/192.168.6.16/9999
[root@es5 ~]# echo "test tcp log" >/dev/tcp/192.168.6.16/8888
[root@es5 ~]#
[root@logstash logstash]# vim logstash.conf
[root@logstash tmp]# cat /etc/logstash/logstash.conf
input{
stdin{ codec => "json" }
file {
path => [ "/tmp/a.log", "/tmp/b.log" ]
sincedb_path => "/var/lib/logstash/sincedb.log"
start_position => "beginning"
type => "filelog"
}
tcp {
mode => "server"
host => "0.0.0.0"
port => 8888
type => "tcplog"
}
udp {
port => 9999
type => "udplog"
}
}
filter{
}
output{
stdout{ codec => "rubydebug" }
}
[root@logstash logstash]# /opt/logstash/bin/logstash -f logstash.conf
Settings: Default pipeline workers: 2
Pipeline main started
{
"message" => "test udp log\n",
"@version" => "1",
"@timestamp" => "2018-07-30T08:40:01.774Z",
"type" => "udplog",
"host" => "192.168.6.15"
}
{
"message" => "test tcp log",
"@version" => "1",
"@timestamp" => "2018-07-30T08:40:37.124Z",
"host" => "192.168.6.15",
"port" => 59100,
"type" => "tcplog"
}
cat /var/log/message
vim /etc/rsyslog.conf
[root@kibana ~]# vim /etc/rsyslog.conf
local0.info /var/log/info.log
EXAMPLES
logger System rebooted
logger -p local0.notice -t HOSTIDM -f /dev/idmc
logger -n loghost.example.com System rebooted
[root@kibana ~]# systemctl restart rsyslog
[root@kibana ~]# cd /var/log/
[root@kibana log]# ls
anaconda boot.log-20180730 cron dmesg.old httpd maillog-20180730 qemu-ga secure-20180730 tallylog yum.log
audit btmp cron-20180730 firewalld lastlog messages rhsm spooler tuned
boot.log chrony dmesg grubby_prune_debug maillog messages-20180730 secure spooler-20180730 wtmp
[root@kibana log]# ls info.log
ls: 无法访问info.log: 没有那个文件或目录
[root@kibana log]# man logger
[root@kibana log]# logger -p local0.info -t "testlog" "a b c d"
[root@kibana log]# cat info.log
Jul 30 17:01:57 kibana testlog: a b c d
@@(tcp)
[root@logstash logstash]# vim logstash.conf
[root@logstash tmp]# cat /etc/logstash/logstash.conf
input{
stdin{ codec => "json" }
file {
path => [ "/tmp/a.log", "/tmp/b.log" ]
sincedb_path => "/var/lib/logstash/sincedb.log"
start_position => "beginning"
type => "filelog"
}
tcp {
mode => "server"
host => "0.0.0.0"
port => 8888
type => "tcplog"
}
udp {
port => 9999
type => "udplog"
}
syslog{
host => "0.0.0.0"
port => 514
type => "syslog"
}
}
filter{
}
output{
stdout{ codec => "rubydebug" }
}
[root@logstash logstash]# /opt/logstash/bin/logstash -f logstash.conf
Settings: Default pipeline workers: 2
Pipeline main started
{
"message" => "helloworld\n",
"@version" => "1",
"@timestamp" => "2018-07-30T09:07:49.000Z",
"type" => "syslog",
"host" => "192.168.6.10",
"priority" => 134,
"timestamp" => "Jul 30 17:07:49",
"logsource" => "kibana",
"program" => "testlog",
"severity" => 6,
"facility" => 16,
"facility_label" => "local0",
"severity_label" => "Informational"
}
[root@kibana log]# man logger
[root@kibana log]# logger -p local0.info -t "testlog" "a b c d"
[root@kibana log]# cat info.log
Jul 30 17:01:57 kibana testlog: a b c d
[root@kibana log]# vim /etc/rsyslog.conf
local7.* /var/log/boot.log
local0.info /var/log/info.log
local0.info @@192.168.6.16:514
[root@kibana log]# systemctl restart rsyslog
[root@kibana log]# logger -p local0.info -t "testlog" "helloworld"
[root@kibana log]# logger -p local0.info -t "testlog" "helloworld"
[root@kibana log]# cat info.log
Jul 30 17:01:57 kibana testlog: a b c d
Jul 30 17:04:19 kibana testlog: helloworld
Jul 30 17:07:49 kibana testlog: helloworld
[root@kibana log]#
@(udp)
[root@kibana log]# vim /etc/rsyslog.conf
local7.* /var/log/boot.log
local0.info /var/log/info.log
local0.info @192.168.6.16:514
[root@kibana log]# systemctl restart rsyslog
[root@kibana log]# logger -p local0.info -t "testlog" "helloworld1"
[root@logstash logstash]# /opt/logstash/bin/logstash -f logstash.conf
Settings: Default pipeline workers: 2
Pipeline main started
{
"message" => "helloworld1",
"@version" => "1",
"@timestamp" => "2018-07-30T09:12:05.000Z",
"type" => "syslog",
"host" => "192.168.6.10",
"priority" => 134,
"timestamp" => "Jul 30 17:12:05",
"logsource" => "kibana",
"program" => "testlog",
"severity" => 6,
"facility" => 16,
"facility_label" => "local0",
"severity_label" => "Informational"
}
//端口查询
[root@logstash tmp]# ss -tunlp
Netid State Recv-Q Send-Q Local Address:Port Peer Address:Port
udp UNCONN 0 0 127.0.0.1:323 *:* users:(("chronyd",pid=471,fd=1))
udp UNCONN 0 0 ::1:323 :::* users:(("chronyd",pid=471,fd=2))
tcp LISTEN 0 128 *:22 *:* users:(("sshd",pid=678,fd=3))
tcp LISTEN 0 100 127.0.0.1:25 *:* users:(("master",pid=774,fd=13))
tcp LISTEN 0 128 :::22 :::* users:(("sshd",pid=678,fd=4))
tcp LISTEN 0 100 ::1:25 :::* users:(("master",pid=774,fd=14))
[root@logstash tmp]# ss -tunlp
Netid State Recv-Q Send-Q Local Address:Port Peer Address:Port
udp UNCONN 0 0 127.0.0.1:323 *:* users:(("chronyd",pid=471,fd=1))
udp UNCONN 0 0 :::514 :::* users:(("java",pid=4265,fd=29))
udp UNCONN 0 0 :::9999 :::* users:(("java",pid=4265,fd=36))
udp UNCONN 0 0 ::1:323 :::* users:(("chronyd",pid=471,fd=2))
tcp LISTEN 0 128 *:22 *:* users:(("sshd",pid=678,fd=3))
tcp LISTEN 0 100 127.0.0.1:25 *:* users:(("master",pid=774,fd=13))
tcp LISTEN 0 128 :::22 :::* users:(("sshd",pid=678,fd=4))
tcp LISTEN 0 50 :::8888 :::* users:(("java",pid=4265,fd=7))
tcp LISTEN 0 100 ::1:25 :::* users:(("master",pid=774,fd=14))
tcp LISTEN 0 50 :::514 :::* users:(("java",pid=4265,fd=40))
logstash 部分
• grok 正则分组匹配
– 匹配 ip 时间戳 和 请求方法
"(?<ip>(\d+\.){3}\d+) \S+ \S+
(?<time>.*\])\s+\"(?<method>[A-Z]+)"]
– 使用正则宏
%{IPORHOST:clientip} %{HTTPDUSER:ident} %{USER:auth}
\[%{HTTPDATE:timestamp}\] \"%{WORD:verb}
– 最终版本
%{COMMONAPACHELOG} \"(?<referer>[^\"]+)\"
\"(?<UA>[^\"]+)\
match => ["message", "(?<client_ip>([12]?\d?\d\.){3}[12]?\d?\d).+[(?<time>.+)\] \"(?<method>[A-Z]+) (?<url>\S+) (?<prot>[^\"]+)\" ]
[root@logstash patterns]# vim grok-patterns
[root@logstash patterns]# pwd
/opt/logstash/vendor/bundle/jruby/1.9/gems/logstash-patterns-core-2.0.5/patterns
COMBINEDAPACHELOG %{COMMONAPACHELOG} %{QS:referrer} %{QS:agent}
filter{
grok {
match => ["message", "%{COMBINEDAPACHELOG}"]
}
}
[root@kibana html]# curl http://www.baidu.com/ -o index.html