matplotlib 基础
import matplotlib as mpl
import matplotlib.pyplot as plt
import numpy as np
x=np.linspace(0,10,100)
x
>>>array([ 0.        ,  0.1010101 ,  0.2020202 ,  0.3030303 ,  0.4040404 ,
        0.50505051,  0.60606061,  0.70707071,  0.80808081,  0.90909091,
        1.01010101,  1.11111111,  1.21212121,  1.31313131,  1.41414141,
        1.51515152,  1.61616162,  1.71717172,  1.81818182,  1.91919192,
        2.02020202,  2.12121212,  2.22222222,  2.32323232,  2.42424242,
        2.52525253,  2.62626263,  2.72727273,  2.82828283,  2.92929293,
        3.03030303,  3.13131313,  3.23232323,  3.33333333,  3.43434343,
        3.53535354,  3.63636364,  3.73737374,  3.83838384,  3.93939394,
        4.04040404,  4.14141414,  4.24242424,  4.34343434,  4.44444444,
        4.54545455,  4.64646465,  4.74747475,  4.84848485,  4.94949495,
        5.05050505,  5.15151515,  5.25252525,  5.35353535,  5.45454545,
        5.55555556,  5.65656566,  5.75757576,  5.85858586,  5.95959596,
        6.06060606,  6.16161616,  6.26262626,  6.36363636,  6.46464646,
        6.56565657,  6.66666667,  6.76767677,  6.86868687,  6.96969697,
        7.07070707,  7.17171717,  7.27272727,  7.37373737,  7.47474747,
        7.57575758,  7.67676768,  7.77777778,  7.87878788,  7.97979798,
        8.08080808,  8.18181818,  8.28282828,  8.38383838,  8.48484848,
        8.58585859,  8.68686869,  8.78787879,  8.88888889,  8.98989899,
        9.09090909,  9.19191919,  9.29292929,  9.39393939,  9.49494949,
        9.5959596 ,  9.6969697 ,  9.7979798 ,  9.8989899 , 10.        ])
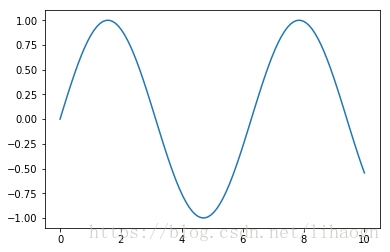
y=np.sin(x)
y
>>>array([ 0.        ,  0.10083842,  0.20064886,  0.2984138 ,  0.39313661,
        0.48385164,  0.56963411,  0.64960951,  0.72296256,  0.78894546,
        0.84688556,  0.8961922 ,  0.93636273,  0.96698762,  0.98775469,
        0.99845223,  0.99897117,  0.98930624,  0.96955595,  0.93992165,
        0.90070545,  0.85230712,  0.79522006,  0.73002623,  0.65739025,
        0.57805259,  0.49282204,  0.40256749,  0.30820902,  0.21070855,
        0.11106004,  0.01027934, -0.09060615, -0.19056796, -0.28858706,
       -0.38366419, -0.47483011, -0.56115544, -0.64176014, -0.7158225 ,
       -0.7825875 , -0.84137452, -0.89158426, -0.93270486, -0.96431712,
       -0.98609877, -0.99782778, -0.99938456, -0.99075324, -0.97202182,
       -0.94338126, -0.90512352, -0.85763861, -0.80141062, -0.73701276,
       -0.66510151, -0.58640998, -0.50174037, -0.41195583, -0.31797166,
       -0.22074597, -0.12126992, -0.0205576 ,  0.0803643 ,  0.18046693,
        0.27872982,  0.37415123,  0.46575841,  0.55261747,  0.63384295,
        0.7086068 ,  0.77614685,  0.83577457,  0.8868821 ,  0.92894843,
        0.96154471,  0.98433866,  0.99709789,  0.99969234,  0.99209556,
        0.97438499,  0.94674118,  0.90944594,  0.86287948,  0.8075165 ,
        0.74392141,  0.6727425 ,  0.59470541,  0.51060568,  0.42130064,
        0.32770071,  0.23076008,  0.13146699,  0.03083368, -0.07011396,
       -0.17034683, -0.26884313, -0.36459873, -0.45663749, -0.54402111])
plt.plot(x,y)
[<matplotlib.lines.Line2D at 0x113097278>]
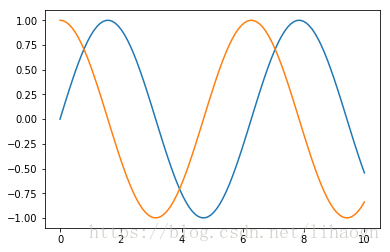
cosy=np.cos(x)
siny=y.copy()
plt.plot(x,siny)
plt.plot(x,cosy)
[<matplotlib.lines.Line2D at 0x1130bb940>]
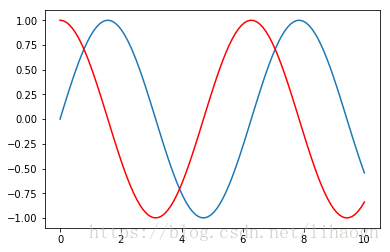
plt.plot(x,siny)
plt.plot(x,cosy,color="red")
[<matplotlib.lines.Line2D at 0x113097908>]
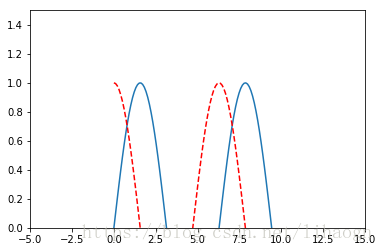
plt.plot(x,siny)
plt.plot(x,cosy,color="red",linestyle="--")
plt.xlim(-5,15)
plt.ylim(0,1.5)
(0, 1.5)
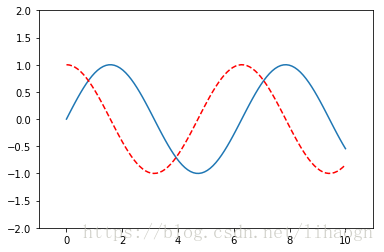
plt.plot(x,siny)
plt.plot(x,cosy,color="red",linestyle="--")
plt.axis([-1,11,-2,2])
[-1, 11, -2, 2]
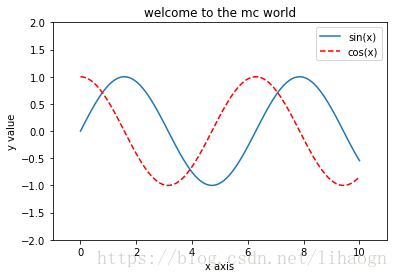
plt.plot(x,siny,label="sin(x)")
plt.plot(x,cosy,color="red",linestyle="--",label="cos(x)")
plt.axis([-1,11,-2,2])
plt.xlabel("x axis")
plt.ylabel("y value")
plt.legend()
plt.title("welcome to the mc world")
Text(0.5,1,'welcome to the mc world')
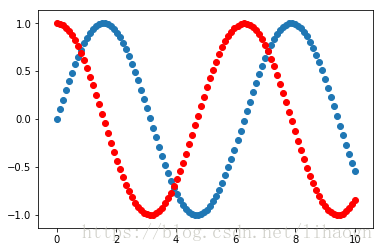
散点图 Scatter plot
plt.scatter(x,siny)
plt.scatter(x,cosy,color="red")
<matplotlib.collections.PathCollection at 0x1177967b8>
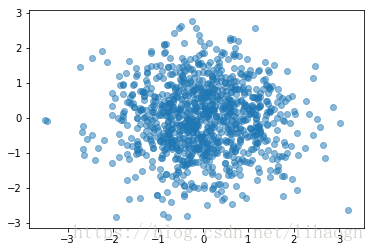
x=np.random.normal(0,1,1000)
y=np.random.normal(0,1,1000)
plt.scatter(x,y,alpha=0.5)
<matplotlib.collections.PathCollection at 0x1170b6518>