最近作图需要用断裂的坐标轴表示无穷点,正好想抛弃pyplot,转向面向对象的matplotlib绘图,所以尝试了用面向对象的方法绘制这个图:
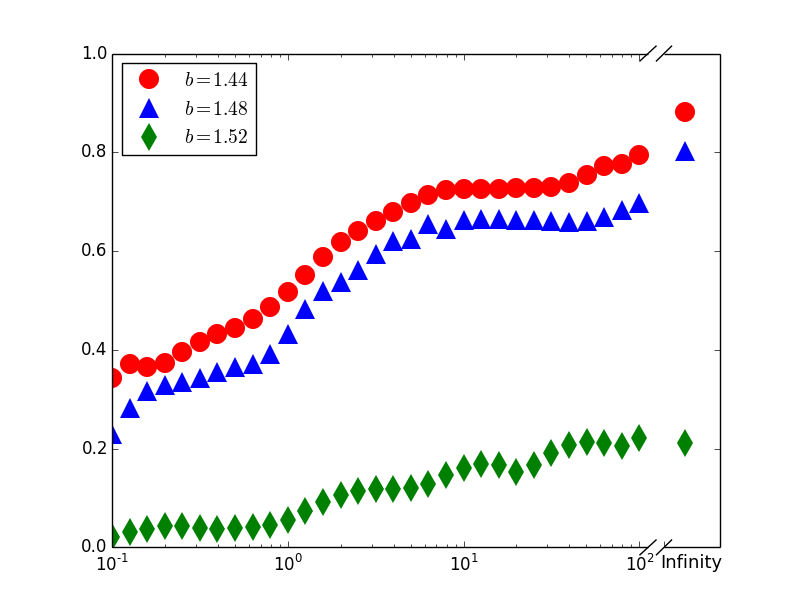
关键在于右边两个斜杠断裂坐标轴,它的做法是把两个图拼在一起,问题包括怎么拼?怎么共享y轴?怎么隐藏两根纵轴?怎么画斜线?怎么消掉右边图的ticks?怎么设置子图大小?
代码是这样的:
# -*- coding: utf-8 -*-
"""
Created on Wed Oct 22 18:06:29 2014

@author: Administrator
"""
import pylab
import numpy as np
import matplotlib.pyplot as pyplot
from matplotlib.lines import Line2D
x = np.arange(0, 100,3)
print x
#x = append(x,z)
t = linspace(0, 1, 6)
xt=linspace(0, 1000, 11)
print x
msvalue=14

f, (ax, ax2) = plt.subplots(1, 2, sharey=True)

for line in open("b1.44data.txt"):
    curLine=line.strip().split('\t')
    aa = [float(i) for i in curLine]
    xx1.append(aa[0])
    yy1.append(aa[1])
for line in open("b1.48data.txt"):
    curLine=line.strip().split('\t')
    aa = [float(i) for i in curLine]
    xx2.append(aa[0])
    yy2.append(aa[1])
for line in open("b1.52data.txt"):
    curLine=line.strip().split('\t')
    aa = [float(i) for i in curLine]
    xx3.append(aa[0])
    yy3.append(aa[1])

ax.semilogx(xx1,yy1,color="r", linewidth=2,marker="o", markeredgecolor='none',markersize=msvalue,
     linestyle=" ", label="$b=1.44$")
ax.semilogx(xx2,yy2,color="b", linewidth=2,marker="^", markeredgecolor='none',markersize=msvalue,
     linestyle=" ", label="$b=1.48$")
ax.semilogx(xx3,yy3,color="g", linewidth=2,marker="d", markeredgecolor='none',markersize=msvalue,
     linestyle=" ", label="$b=1.52$")
#ax.set_xticks([0.1,1,10,100],[0.1,100,100,100])
x2=[200,200,200]
y2=[0.88255,0.8026,0.21225]
xinf=150
ax2.semilogx(xinf,0.88255,color="r", linewidth=2,marker="o", markeredgecolor='none',markersize=msvalue,
     linestyle=" ")
ax2.semilogx(xinf,0.8026,color="b", linewidth=2,marker="^", markeredgecolor='none',markersize=msvalue,
     linestyle=" ")
ax2.semilogx(xinf,0.21225,color="g", linewidth=2,marker="d", markeredgecolor='none',markersize=msvalue,
     linestyle=" ")
ax2.set_ylim(0, 1)

ax.spines['right'].set_visible(False)
ax2.spines['left'].set_visible(False)
ax.yaxis.tick_left()
ax2.yaxis.tick_right() //把标注(纵轴上的小杠杠)设置为只在左边显示
ax2.tick_params(labelright='off')  //关掉右边的ticks数字
ax2.xaxis.tick_bottom()
ax2.tick_params(labelbottom='off')

ax2.set_xticks([1],[1])
#align_yaxis(ax1, 0, ax2, 0)
#ylim(y1.min()*1.1, y1.max()*1.3)
ax.legend(loc='upper left',numpoints=1,fontsize=14)
#xticks([0.1,1,10,100],[a,a,a,a,])
d = .015  # how big to make the diagonal lines in axes coordinates
# arguments to pass plot, just so we don't keep repeating them
kwargs = dict(transform=ax.transAxes, color='k', clip_on=False)
ax.plot((1 - d, 1 + d), (1-d, 1+d), **kwargs)        # 左上斜杠
ax.plot((1 - d, 1 + d), (-d, +d), **kwargs)  # 左下斜杠
kwargs.update(transform=ax2.transAxes)  # switch to the bottom axes
d= .015
d2=0.135
ax2.plot((-d2, +d2), (1 - d, 1 + d), **kwargs)  # 右上斜杠
ax2.plot((-d2, +d2), (-d, +d), **kwargs)    # 右下斜杠
left,width=0.14,0.67
bottom,height=0.08,0.83
left_r=left+width+0.02
width_r=0.07
rect_line1=[left,bottom,width,height]
rect_line2=[left_r,bottom,width_r,height]
ax.set_position(rect_line1)
ax2.set_position(rect_line2) #上面几行设置了子图的大小和位置,需要细细调整
ax2.set_xlim(100,300)
ax.set_xlim(0,112)
xlabel("Infinity",fontsize=13)
f.show()
整个过程下来还是很费功夫的,主要是对面向对象的绘图不太熟悉,后面要专门写个博客整理下,尤其是哪些对象有那些属性和方法,应该怎么查等等。今后作图应该尽量用标准化的面向对象的方法做,不要偷懒。
主要参考了以下几个网页:
http://stackoverflow.com/questions/21022784/how-to-plot-fx-as-x-goes-to-infinity-with-matplotlib
http://matplotlib.org/examples/pylab_examples/broken_axis.html
https://www.zhihu.com/question/21953954