本篇内容:
坐标轴名称(axis label):x 轴和 y 轴名称的设置
坐标系标题(title):单坐标系标题、多坐标系标题、Figure 标题的设置
坐标轴刻度(tick label):坐标轴刻度字号大小的设置
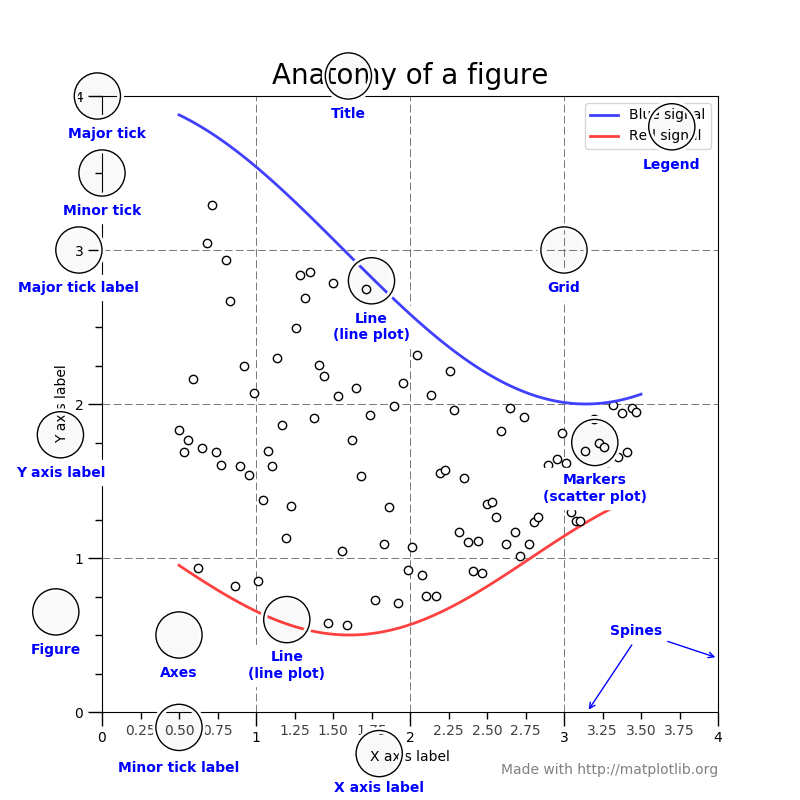
图片来自:Usage Guide
首先定义绘图的 x 和 y 值,后续在各节展示绘制目标,统一就用这里定义的 x 和 y,不再赘述。
x = np.arange(1, 5)
y = x**2
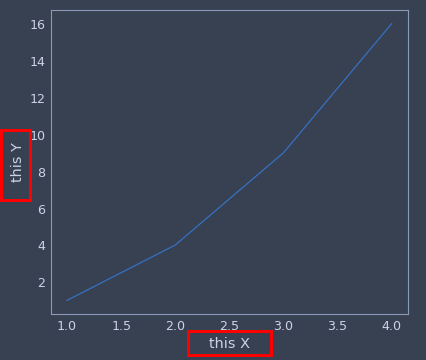
坐标轴名称(axis label)
为 x 轴和 y 轴添加名称,当我们的 figure 上只有一套 axes 时,使用 plt.xlabel() 可以直接为 x 轴添加标签,y 轴同理。
(关于 figure 和 axes 的区别,可以参考:matplotlib绘图:figure和axes有什么区别?)
fig = plt.figure()
plt.plot(x, y)
plt.xlabel("this X")  # here
plt.ylabel("this Y")
plt.show()
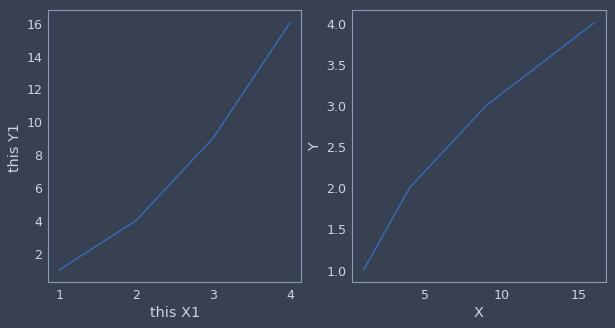
如果在 figure 中有多套 axes,可以使用 .set_xlabel() 为指定的 axes 添加 x 轴标签,y 轴同理。
注意 在有多套 axes 的情况下若使用 plt.xlabel(),默认作用的是最后一套 axes,这里就是第二套坐标系(axes_2)。
fig = plt.figure(figsize=(10,5))
axes_1 = plt.subplot(121)
axes_2 = plt.subplot(122)

axes_1.plot(x,y)
axes_2.plot(y,x)
axes_1.set_xlabel("this X1")   # here
axes_1.set_ylabel("this Y1")

plt.xlabel("X")  # 作用在 axes_2
plt.ylabel("Y")
plt.show()
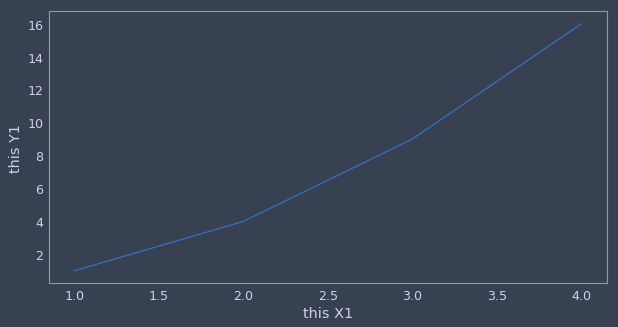
当 figure 中只有一套 axes 时,plt.xlabel() 和 axes.set_xlabel() 都可以设置 x 轴名称,效果是一样的。当 figure 中有多套 axes 时,建议使用 axes 对象名称并利用 .set_xlabel() 方法来添加 x 轴名称,这样代码比较清晰。
fig = plt.figure(figsize=(10,5))
axes = plt.subplot(111)
axes.plot(x,y)
axes.set_xlabel("this X1")
axes.set_ylabel("this Y1")
# plt.xlabel("X")  # 效果等价
# plt.ylabel("Y")
plt.show()
坐标系标题
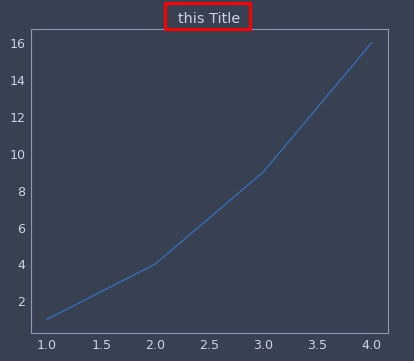
为坐标系添加标题,当我们的 figure 上只有一套 axes 时,使用 plt.title() 可以直接为当前坐标系添加标题。
fig = plt.figure()
plt.plot(x, y)
plt.title("this Title")  # here
plt.show()
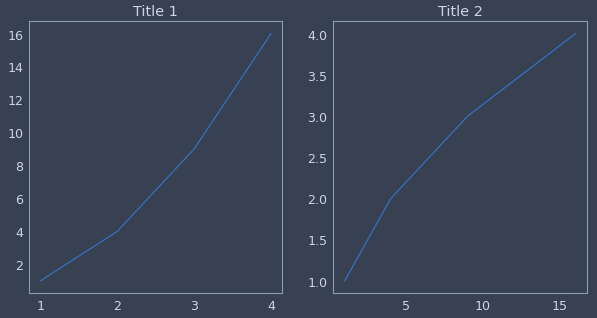
如果在 figure 中有多套 axes,可以使用 .set_xlabel() 为指定的坐标系添加标题。
fig = plt.figure(figsize=(10,5))
axes_1 = plt.subplot(121)
axes_2 = plt.subplot(122)

axes_1.plot(x,y)
axes_2.plot(y,x)
axes_1.set_title("Title 1")
axes_2.set_title("Title 2")
plt.show()
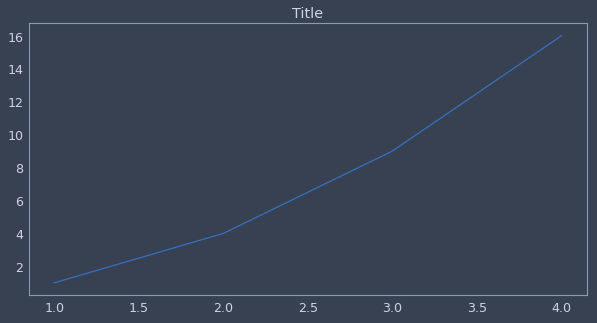
当 figure 中只有一套 axes 时,plt.title() 和 axes.set_title() 都可以设置坐标系标题。当 figure 中有多套 axes 时,建议使用 axes 对象名称并利用 .set_title() 方法来添加 x 轴名称,这样代码比较清晰。
fig = plt.figure(figsize=(10,5))
axes = plt.subplot(111)
axes.plot(x,y)
axes.set_title("Title")
# plt.title("Title")
plt.show()
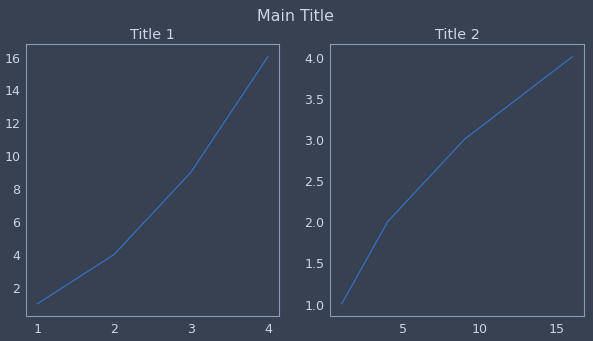
若要为整个 figure(在包括多套 axes 的情况下)设置一个主标题,可以使用 plt.suptitle() 来完成。
fig = plt.figure(figsize=(10,5))
axes_1 = plt.subplot(121)
axes_2 = plt.subplot(122)

axes_1.plot(x,y)
axes_2.plot(y,x)
axes_1.set_title("Title 1")
axes_2.set_title("Title 2")
plt.suptitle('Main Title')
plt.show()
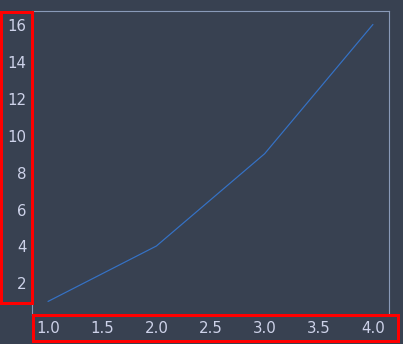
坐标轴刻度(tick label)
修改 tick label 字号大小,当我们的 figure 上只有一套 axes 时,使用 plt.tick_params 的参数 labelsize 可以修改坐标轴刻度字号。
fig = plt.figure()
plt.plot(x,y)
plt.tick_params(labelsize=15)  # here
plt.show()
如果使用的是 axes 对象,也可以通过 .tick_params(labelsize) 来进行指定。
fig = plt.figure()
axes = plt.subplot(111)
axes.plot(x,y)
axes.tick_params(labelsize=15)  # here
plt.show()