spring-boot-starter-actuator是Spring-boot中非常有用的模块,该模块能够自动为Spring boot构建的应用提领一系列用于监控的端点。同时,也为后续的Spring-cloud在实现各个微服务组件的时候,进行了很多扩展。spring-boot-starter-actuator对实施中小的微服务的团队有效的省去或大大减少监控系统在采集应用指标时的开发量。当然有些时候也需要我们自己对其做一些简单的扩展。
下面我们通过一个简单入门的Spring-boot项目来讲解一下spring-boot-starter-actuator模块功能。
打开IDEA新建一个Spring-boot项目,在pom.xml文件中加入以下依赖:
<dependency>
    <groupId>org.springframework.boot</groupId>
    <artifactId>spring-boot-starter-actuator</artifactId>
    <version>2.0.3.RELEASE</version>
</dependency>
增加该依赖以后,我们启动项目,会发现以下内容:
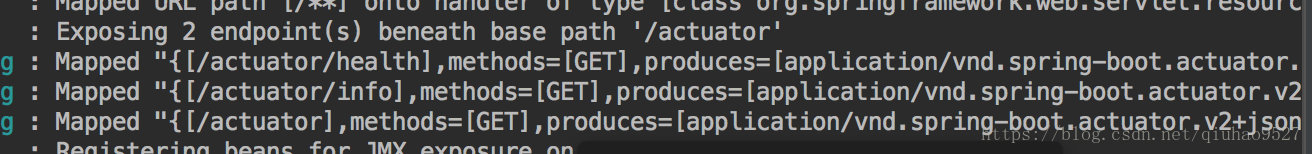
默认在2.0.3版本下,Spring-boot启动了health和info端点。
要想启动自己想要的监控端点或者全部的端点,需要application.properties配置文件中,添加:
management.endpoints.web.exposure.include如果要启动全部的端点,那么就配置:
management.endpoints.web.exposure.include=*如果只想启动指定的端点,就配置:
management.endpoints.web.exposure.include=["health","info","loggers","env","beans"]然后启动项目,通过浏览器访问 /actuator端点就可以看到启动了那些监控端点:

在spring-boot-starter-actuator模块中默认的原生端点包括三类:
1、应用配置类;2、度量指标类;3、操作控制类。
接下来对上面三类中几个比较常用的端点进行讲解:
应用配置类中:
(1)/beans 端点,通过/actuator/beans来访问,用来获取上下文中创建的所有bean:

通过上图我们可以看到bean中包含了下面这些信息:
bean:Bean的名称
scope: bean的作用域
type:Bean的java类型
resource:class文件的具体路径
dependencies:依赖的bean名称 ;
(2)/configprops ,访问路径:/actuator/configprops,该端点用来获取应用中配置的属性信息报告。

prefix属性代表了属性的配置前缀,properties代表了各个属性的名称和值,如果我们要关闭这个端点,就可以在配置文件中配置:
management.endpoint.configprops.enabled=false(3)/env ,访问路径:/actuator/env ,是用来获取应用所有可用的环境属性报告,包括环境变量、JVM属性、应用的配置、命令行的参数.

上图中就显示了部分环境属性,我们可以使用@ConfigurationProperties注解将它们引入到我们程序中来使用,为了安全考虑,对于一些password,secret,key这些关键词,进行了隐藏。
(4)/mappings,访问路径 /actuator/mappings,该端点用来返回所有的SpringMVC的控制器映射关系报告。

(5) /info 访问路径:/actuator/info,用来返回一些在配置文件自定义的属性,如果没有自定义的属性,默认会返回一个空的json字符串,但是如果在application.properties配置文件中用info前缀了设置一些属性,比如:
info.app.name=spring-boot-hello
info.app.version=0.0.1
然后再访问info端点:
{"app":{"name":"spring-boot-hello","version":"0.0.1"}}亮度指标类:提供的报告内容则是动态变化的,这些端点提供了应用程序在运行过程中的一些快照信息,比如内存使用情况,HTTP请求统计,外部资源指标等。
(1)/metrics 访问路径/actuator/metrics ,这个端点用来统计内存信息、线程信息、垃圾回收信息等.

然后可以通过上面的值来获得每一个指标的值,比如:
http://localhost:8888/actuator/metrics/jvm.memory.used可以得到以下值:
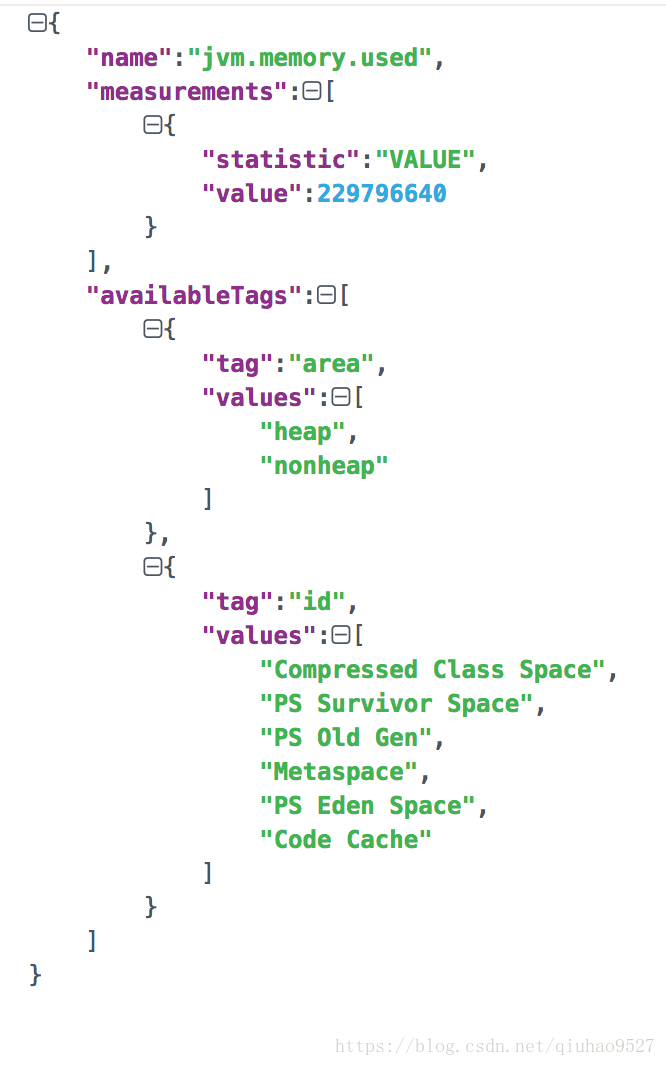
依次类推也可以得到其他的指标值。
(2)/health 访问路径:/actuator/health 用来获取应用的各类健康指标信息。在Spring-boot-starter-actuator模块中自带了一些常用的健康指标检测器。这些检测器都通过HealthIndicator接口实现,会根据依赖关系的引入自动化装配,比如下面这些:
| 检测器 | 功能 |
|---|---|
| DiskSpaceHealthIndicator | 低磁盘空间检测 |
| DataSourceHealthIndicator | 检测DataSource的连接是否可用 |
| MongoHealthIndicator | 检测Mongo数据库是否可用 |
| RabbitHealthIndicator | 检测Rabbit数据库是否可用 |
| RedisHealthIndicator | 检测Redis数据库是否可用 |
| SolrHealthIndicator | 检测Solr服务器是否可用 |
如果我们想使用去检测其他的服务器或者中间体,我们可以自己编写检测逻辑,只需要实现HealthIndicator接口,通过重写health()方法来实现健康检测。在返回的Health对象中,共有两个内容,一个是状态信息,UP 、DOWN、UNKNOWN和OUT_OF_SERVICE;还有一个详细信息采用Map的方式存储,通过withDetail函数。如下:
@Component
public class MyHealthIndicator implements HealthIndicator {

    @Override
    public Health health() {
        int code=check();
        if(code==-1){
            return Health.down().withDetail("Error Code",code).build();
        }
        return Health.up().build();
    }

    private int check(){
      //对监控对象的检测操作
    }
}
我们也可以自定义状态码,在applicatio n.properites文件中,配置health的自定义状态码:
management.health.status.order=DOWN,OUT_OF_SERVICE,UNKNOWN,UP,ODD,EVENT@Component
public class MyHealthIndicator implements HealthIndicator {
@Override
public Health health() {
if(check()){
return Health.status("DOWN").withDetail("出错啦",101).build();
}
return Health.status("EVENT").build();
}
private boolean check(){
int num=(int)Math.random()*100;
if(num>50){
return false;
}else{
return true;
}
}
}如果想要展示上面的withDetail中的信息,就要在appliction.properties配置文件中,配置:
management.endpoint.health.show-details=always源码显示:
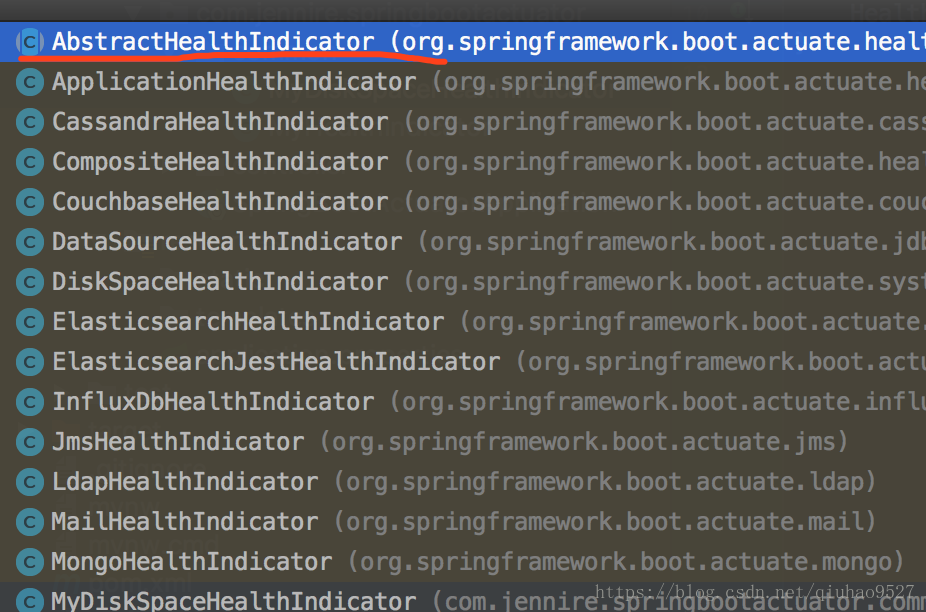

自带的health检测器都是继承AbstraceHealthIndicator抽象类。
所以除了继承HealthIndicator接口来实现我们的自定义的检测器,还可以继承AbstraceHealthIndicator,重写它的doHealthCheck()方法即可。

代码如下:
@Component
public class MyDiskSpaceHealthIndicator extends AbstractHealthIndicator {
private final FileStore fileStore;
private final long thresholdBytes;
@Autowired
public MyDiskSpaceHealthIndicator(
@Value("${health.filestore.path:/}") String path,
@Value("${health.filestore.threshold.bytes:10485760}") long thresholdBytes)
throws IOException {
fileStore = Files.getFileStore(Paths.get(path));
this.thresholdBytes = thresholdBytes;
}
@Override
protected void doHealthCheck(Health.Builder builder) throws Exception {
long diskFreeInBytes = fileStore.getUnallocatedSpace();
if (diskFreeInBytes >= thresholdBytes) {
builder.up();
} else {
builder.down();
}
long totalSpaceInBytes = fileStore.getTotalSpace();
builder.withDetail("disk.free", diskFreeInBytes);
builder.withDetail("disk.total", totalSpaceInBytes);
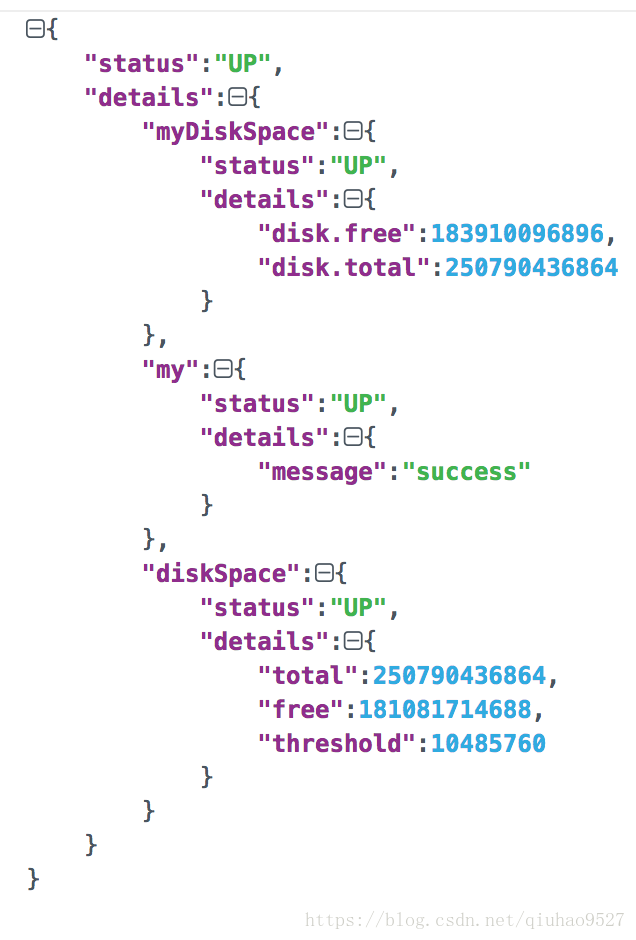
}
}重启项目,访问:http://localhost:8888/actuator/health 显示:
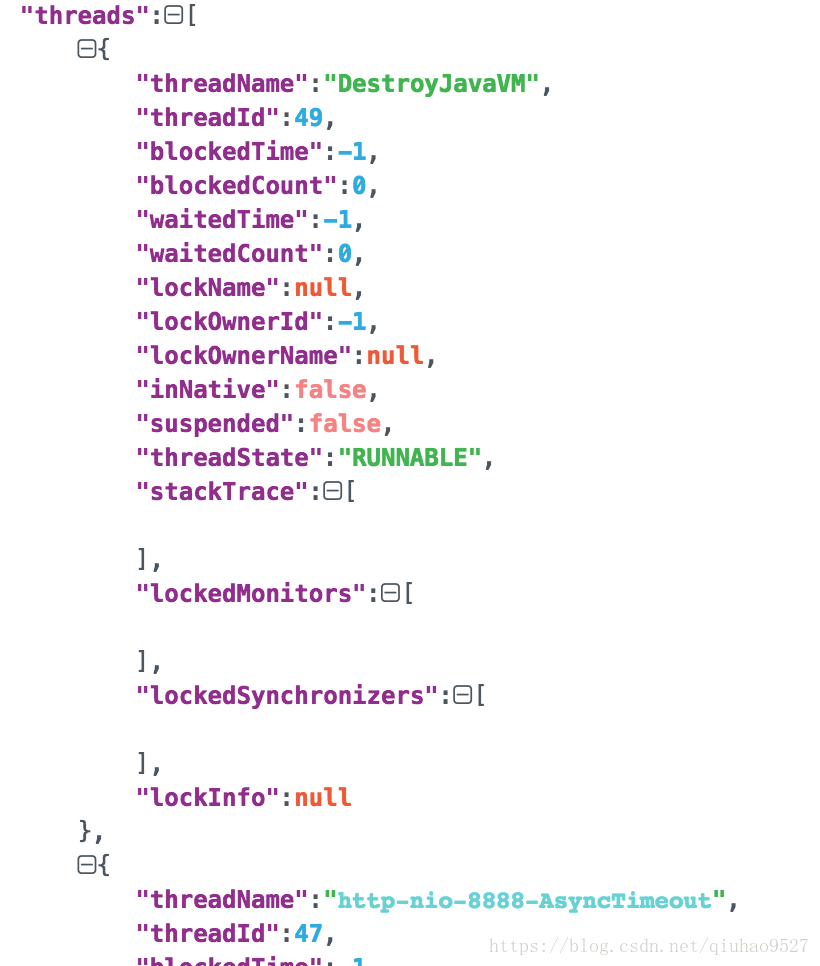
(3) /threaddump 访问路径/actuator/threaddump ,这个端点是返回应用中的线程信息。:
(4) /httptrace 访问路径:/actuator/httptrace 用来返回基本的HTTP跟踪信息,返回了WEB的请求情况。

以上的这些监控端点在Spring cloud中都有很大的作用。