微服务的特点决定了功能模块的部署是分布式的,大部分功能模块都是运行在不同的机器上,彼此通过服务调用进行交互,前后台的业务流会经过很多个微服务的处理和传递,出现了异常如何快速定位是哪个环节出现了问题?
在这种框架下,微服务的监控显得尤为重要。本文主要结合Spring Boot Actuator,跟大家一起分享微服务Spring Boot Actuator的常见用法,方便我们在日常中对我们的微服务进行监控治理。
spring-boot-actuator模块提供了一个监控和管理生产环境的模块,可以使用http、jmx、ssh、telnet等来管理和监控应用。审计(Auditing)、 健康(health)、数据采集(metrics gathering)会自动加入到应用里面。
1、添加依赖
<dependencies>
    <dependency>
        <groupId>org.springframework.boot</groupId>
        <artifactId>spring-boot-starter-web</artifactId>
    </dependency>
    <dependency>
        <groupId>org.springframework.boot</groupId>
        <artifactId>spring-boot-starter-actuator</artifactId>
    </dependency>
    <dependency>
        <groupId>org.springframework.boot</groupId>
        <artifactId>spring-boot-starter-security</artifactId>
    </dependency>
</dependencies>
为了保证actuator暴露的监控接口的安全性,需要添加安全控制的依赖spring-boot-start-security依赖,访问应用监控端点时,都需要输入验证信息。Security依赖,可以选择不加,不进行安全管理,但不建议这么做。
2、application.yml配置文件
server:
  port: 8080
management:
  security:
    enabled: false #关掉安全认证
  port: 8088 #管理端口调整成8088
  context-path: /monitor #actuator的访问路径
endpoints:
  shutdown:
    enabled: true

info:
   app:
      name: spring-boot-actuator
      version: 1.0.0
management.security.enabled=false默认有一部分信息需要安全验证之后才可以查看,如果去掉这些安全认证,直接设置management.security.enabled=false
management.context-path=/monitor 代表启用单独的url地址来监控Spring Boot应用,为了安全一般都启用独立的端口来访问后端的监控信息
endpoints.shutdown.enabled=true 启用接口关闭Spring Boot
配置完成之后,启动项目就可以继续验证各个监控功能了。
服务访问URL:http://localhost:8080
监控访问URL:http://localhost:8088/monitor/
3、命令详解
3.1、autoconfig
Spring Boot的自动配置功能非常便利,但有时候也意味着出问题比较难找出具体的原因。使用 autoconfig 可以在应用运行时查看代码某个配置在什么条件下生效,或者某个自动配置为什么没有生效。
启动示例项目,访问:http://localhost:8088/monitor/autoconfig
3.2、configprops
查看配置文件中设置的属性内容,以及一些配置属性的默认值。
启动示例项目,访问:http://localhost:8088/monitor/configprops
3.3、beans
根据示例就可以看出,展示了bean的别名、类型、是否单例、类的地址、依赖等信息。
启动示例项目,访问:http://localhost:8088/monitor/beans
3.4、dump
/dump 接口会生成当前线程活动的快照。这个功能非常好,方便我们在日常定位问题的时候查看线程的情况。
主要展示了线程名、线程ID、线程的状态、是否等待锁资源等信息。
启动示例项目,访问:http://localhost:8088/monitor/dump
3.5、env
展示了系统环境变量的配置信息,包括使用的环境变量、JVM 属性、命令行参数、项目使用的jar包等信息。和configprops不同的是,configprops关注于配置信息,env关注运行环境信息。
启动示例项目,访问:http://localhost:8088/monitor/env
为了避免敏感信息暴露到 /env 里,所有名为password、secret、key(或者名字中最后一段是这些)的属性在 /env 里都会加上“*”。
举个例子,如果有一个属性名字是database.password,那么它在/env中的显示效果是这样的:"database.password":"******"
/env/{name}用法
就是env的扩展 可以获取指定配置信息,比如:http://localhost:8088/monitor/env/java.vm.version,返回:{"java.vm.version":"25.101-b13"}
3.6、health
可以看到 HealthEndPoint 给我们提供默认的监控结果,包含磁盘检测和数据库检测
启动示例项目,访问:http://localhost:8088/monitor/health返回部分信息,下面的JSON响应是由状态、磁盘空间和db。描述了应用程序的整体健康状态,UP 表明应用程序是健康的。磁盘空间描述总磁盘空间,剩余的磁盘空间和最小阈值。application.properties阈值是可配置的
{
  "status": "UP",
  "diskSpace": {
    "status": "UP",
    "total": 209715195904,
    "free": 183253909504,
    "threshold": 10485760
  }
  "db": {
        "status": "UP",
        "database": "MySQL",
        "hello": 1
    }
}
其实看 Spring Boot-actuator 源码,你会发现 HealthEndPoint 提供的信息不仅限于此,org.springframework.boot.actuate.health 包下 你会发现 ElasticsearchHealthIndicator、RedisHealthIndicator、RabbitHealthIndicator 等
3.7、info
info就是我们自己配置在配置文件中以Info开头的配置信息,比如我们在示例项目中的配置是:
info:
   app:
      name: spring-boot-actuator
      version: 1.0.0
启动示例项目,访问:http://localhost:8088/monitor/info返回部分信息如下:
{
  "app": {
    "name": "spring-boot-actuator",
    "version": "1.0.0"
  }
}
3.8、mappings
描述全部的URI路径,以及它们和控制器的映射关系
启动示例项目,访问:http://localhost:8088/monitor/mappings
3.9、metrics
最重要的监控内容之一,主要监控了JVM内容使用、GC情况、类加载信息等。
启动示例项目,访问:http://localhost:8088/monitor/metrics
4.0、shutdown
开启接口优雅关闭Spring Boot应用,要使用这个功能首先需要在配置文件中开启:
endpoints:
  shutdown:
    enabled: true
配置完成之后,启动示例项目,访问:http://localhost:8088/monitor/shutdown返回部分信息如下:
{
    "message": "Shutting down, bye..."
}
此时你会发现应用已经被关闭。
4.1、trace
/trace接口能报告所有Web请求的详细信息,包括请求方法、路径、时间戳以及请求和响应的头信息,记录每一次请求的详细信息。
启动示例项目,先访问一次:http://localhost:8080/hello,再到浏览器执行:http://localhost:8088/monitor/trace查看返回信息:
[
  {
    "timestamp": 1516780334777,
    "info": {
      "method": "GET",
      "path": "/hello",
      "headers": {
        "request": {
          "host": "localhost:8080",
          "connection": "keep-alive",
          "cache-control": "max-age=0",
          "user-agent": "Mozilla/5.0 (Windows NT 10.0; Win64; x64) AppleWebKit/537.36 (KHTML, like Gecko) Chrome/63.0.3239.84 Safari/537.36",
          "upgrade-insecure-requests": "1",
          "accept": "text/html,application/xhtml+xml,application/xml;q=0.9,image/webp,image/apng,*/*;q=0.8",
          "accept-encoding": "gzip, deflate, br",
          "accept-language": "zh-CN,zh;q=0.9",
          "cookie": "UM_distinctid=16053ba344f1cd-0dc220c44cc94-b7a103e-13c680-16053ba3450751; Hm_lvt_0fb30c642c5f6453f17d881f529a1141=1513076406,1514961720,1515649377; CNZZDATA1260945749=232252692-1513233181-%7C1516085149; Hm_lvt_6d8e8bb59814010152d98507a18ad229=1515247964,1515296008,1515672972,1516086283"
        },
        "response": {
          "X-Application-Context": "application:8080",
          "Content-Type": "text/html;charset=UTF-8",
          "Content-Length": "11",
          "Date": "Wed, 24 Jan 2018 07:52:14 GMT",
          "status": "200"
        }
      },
      "timeTaken": "4"
    }
  }
]
上述信息展示了,/hello请求的详细信息。
4、其它配置
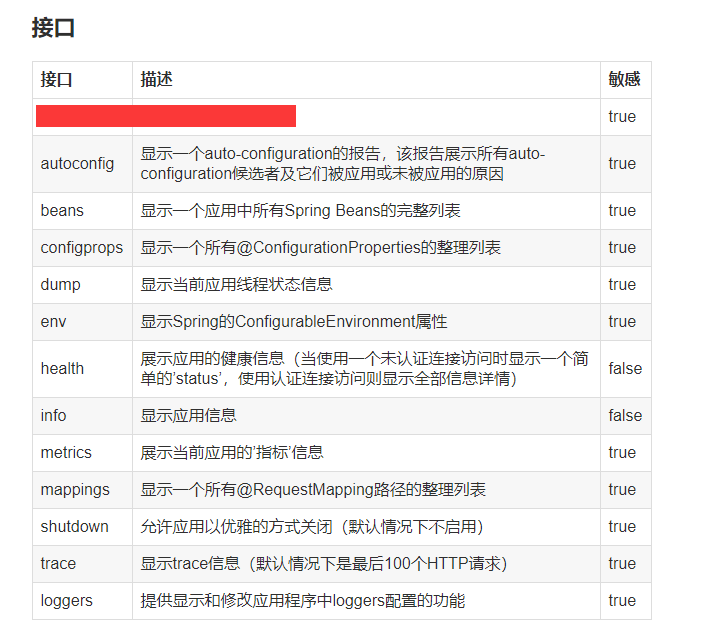
a、敏感信息访问限制
根据上面表格,鉴权为false的,表示不敏感,可以随意访问,否则就是做了一些保护,不能随意访问。
endpoints.mappings.sensitive=false
这样需要对每一个都设置,比较麻烦。敏感方法默认是需要用户拥有ACTUATOR角色,因此,也可以设置关闭安全限制:
management.security.enabled=false
或者配合Spring Security做细粒度控制。
b、启用和禁用接口
虽然Actuator的接口都很有用,但你不一定需要全部这些接口。默认情况下,所有接口(除了/shutdown)都启用。比如要禁用 /metrics 接口,则可以设置如下:
endpoints.metrics.enabled = false
如果你只想打开一两个接口,那就先禁用全部接口,然后启用那几个你要的,这样更方便。
endpoints.enabled = false
endpoints.metrics.enabled = true