说明:本文仅作为本人学习<<深入理解Spring Cloud与微服务构建>>一书的学习笔记,所有代码案例及文字描述均参考该书,不足之处,请留言指正,不胜感激.
一.Spring Cloud Sleuth是干什么的
Spring Cloud Sleuth是Spring Cloud的一个组件,它的主要功能是在分布式系统中提供服务链路追踪的解决方案.
二.为什么需要Spring Cloud Sleuth
一个微服务系统往往有很多个服务单元,业务复杂性较高,如果出现错误和异常,很难去定位.因为一个请求可能需要调用很多个服务,而内部服务的调用可能很复杂.如果有分布式链路追踪,去跟进一个请求到底有哪些服务参与,参与的顺序又是怎样的,从而达到每个请求的步骤清晰可见,出了问题可以快速定位的目的.
三.Zipkin的介绍.
目前,常见的链路追踪组件有Google的Dapper,Twitter的Zipkin,以及阿里的Eagleeye(鹰眼)等,它们都是非常优秀的链路追踪开源组件.本文主要讲述如何在Spring Cloud Sleuth中集成Zipkin.
四.基本术语介绍.
Spring Cloud Sleuth采用了Google的开源项目Dapper的专业术语.
a.Span: 基本工作单元,发送一个远程调度任务就会产生一个Span,Span是用一个64位ID唯一标识的.它包含了例如摘要,时间戳事件,Span的ID以及进程ID.
b.Trace: 由一系列Span组成的,呈树状结构.请求一个微服务系统的API接口,这个API接口需要调用多个微服务单元,调用每个微服务单元都会产生新的Span,而Trace就是由这些Span组成的另一个64位ID唯一标识的.
c.Annotation:用于记录一个事件,一些核心注解用于定义一个请求的开始和结束,这些注解如下:
c1.cs-Client Sent:客户端发送一个请求,这个注解描述Span的开始.
c2.sr-Server Received:服务端获得请求并准备开始处理它,将sr减去cs时间戳,便可以得到网络传输的时间.
c3.ss-Server Sent: 服务端发送响应,该注解表明请求处理的完成(当请求返回客户端),用ss的时间戳减去sr时间戳,便可以得到服务器请求的时间.
c4.cr-Client Received: 客户端接收响应,此时Span结束,用cr时间戳减去cs时间戳,便可以得到整个请求所消耗的时间.
五.Zipkin Server服务的搭建
1.新建一个Module工程,取名zipkin-server,并引入Zipkin Server的依赖zipkin-server,以及Zipkin Server的UI界面依赖zipkin-autoconfigure-ui.它们分别提供了Zipkin的功能和Zipkin界面展示功能,如下:
<dependency>
    <groupId>io.zipkin.java</groupId>
    <artifactId>zipkin-server</artifactId>
</dependency>
<dependency>
    <groupId>io.zipkin.java</groupId>
    <artifactId>zipkin-autoconfigure-ui</artifactId>
</dependency>
2.在zipkin-server的启动类上加上@EnableZipkinServer注解,开启ZipkinServer的功能,如下:
@SpringBootApplication
@EnableEurekaClient
@EnableZipkinServer
public class ZipkinServerApplication {
    public static void main(String[] args) {
        SpringApplication.run(ZipkinServerApplication.class, args);
    }
}
3.在application.yml文件中加上如下配置:
eureka:
  client:
    service-url:
      defaultZone: http://localhost:8761/eureka
server:
  port: 9411
spring:
  application:
    name: zipkin-server
到此为止,Zipkin Server就集成完毕了.
六.Zipkin Client服务的搭建
简单的说明一下,在Spring Cloud框架下,我们除了Eureka以外的其他服务都需要向Eureka注册,所以它们都可以称之为Eureka Client,这里也同理,除Zipkin Server以外的其他服务都需要将数据传递给Zipkin Server,所以我对它们统称Zipkin Client.
我们首先引入Zipkin Client的起步依赖,如下:
<dependency>
    <groupId>org.springframework.cloud</groupId>
    <artifactId>spring-cloud-starter-zipkin</artifactId>
</dependency>
其次,在配置文件中指定Zipkin Server的地址为http://localhost:9411. spring.sleuth.sampler.percentage=1.0,即以100%的概率将链路的数据上传到Zipkin Server,默认情况下,改值为0.1.配置如下:
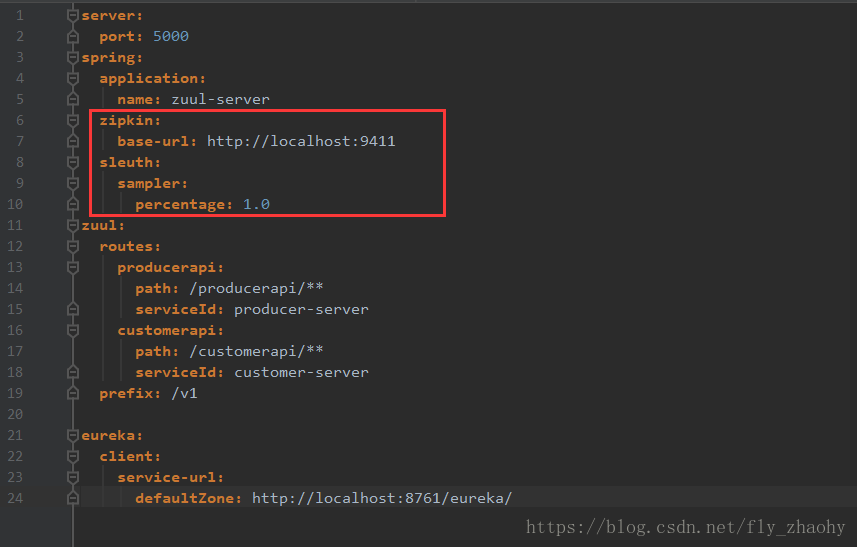
上面的是网关服务配置Zipkin Client的方法,就两步,引入依赖和配置地址.所有其他的Zipkin Client也都是这样配置的.
七.项目演示
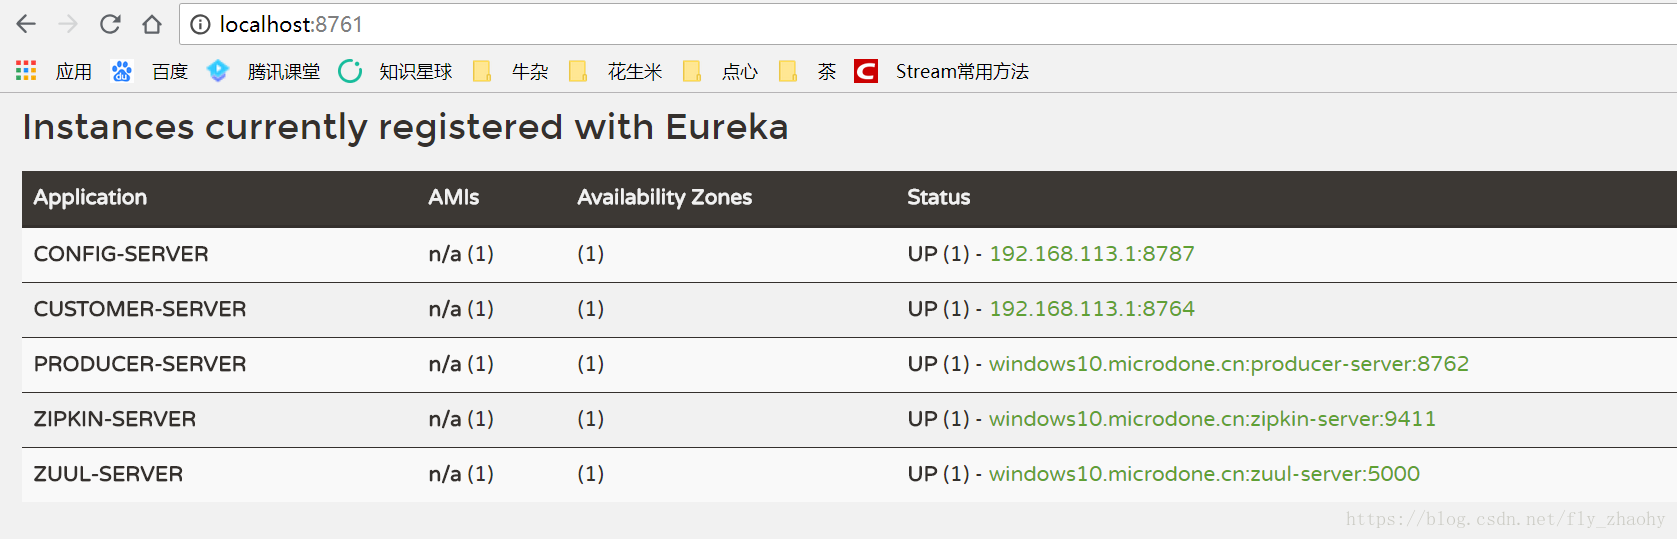
一次启动eureka-server,config-server,zipkin-server,zuul-server,producer-server,customer-server,如下:
在浏览器访问http://localhost:5000/v1/producerapi/producer/hello?token=fly, http://localhost:5000/v1/customerapi/customer/hiByFeign?token=fly, 然后打开http://localhost:9411, 即Zipkin的展示页面,界面显示如图:
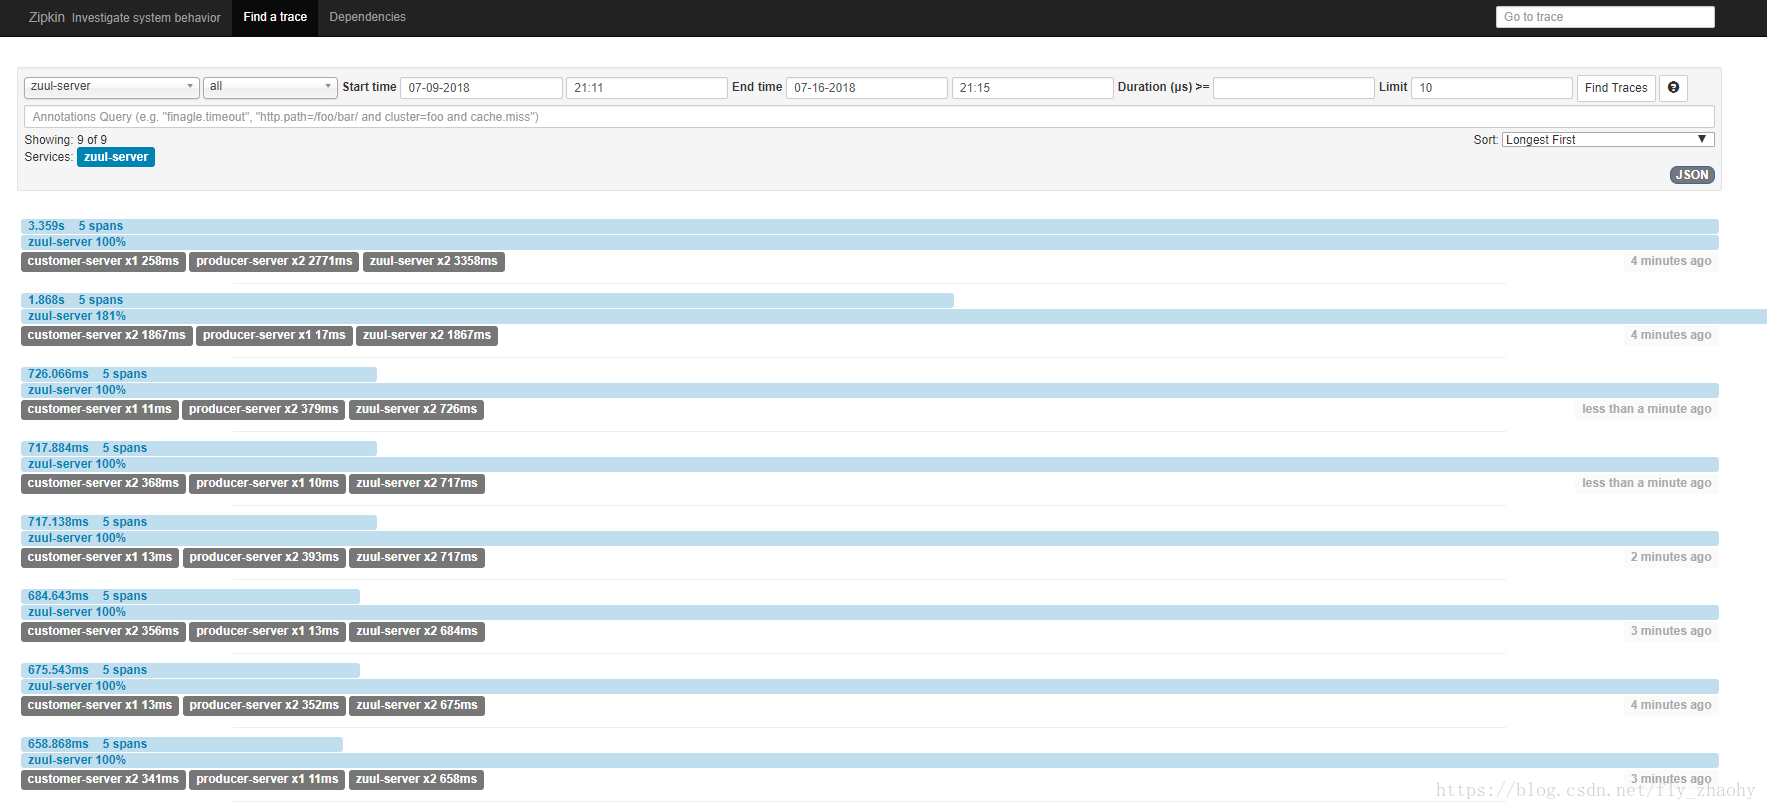
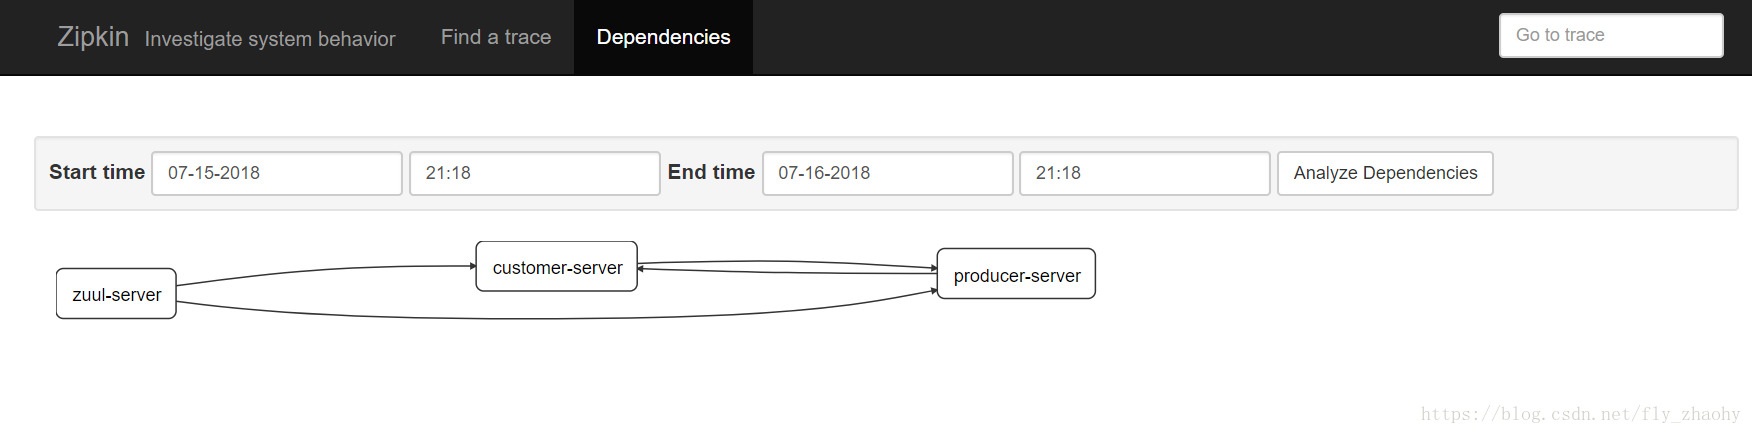
这个界面用于展示Zipkin Server收集的链路数据,可以根据服务名,开始时间,结束时间,请求消耗的时间来查找.单击”Find Tracks”按钮可以查询请求的调用情况.点击”Dependences”,可以查看服务的依赖关系,如图: