[Unity优化]Unity Android Profiler
Unity Script Debugging on Android with MonoDevelop is only supported via WiFi. It is not possible via USB Cable。
PC设置:
1、检查防火墙,开启防火墙端口54999
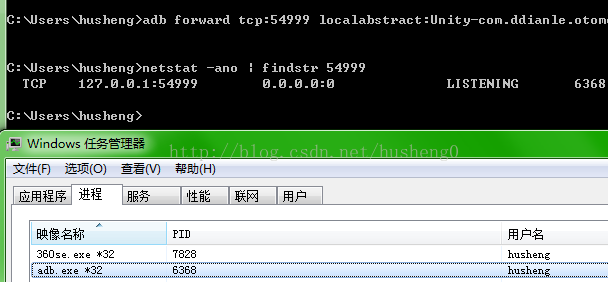
2、adb forward tcp:54999 localabstract:Unity-xxx.xxx.xxx
xxx.xxx.xxx为游戏包名。
3、查看占用54999端口的进程:netstat -ano | findstr 54999
Unity打包设置:
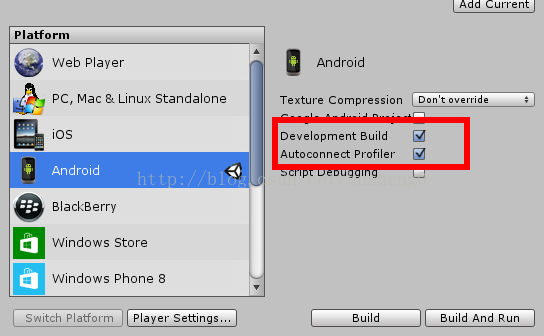
1、Build Setting
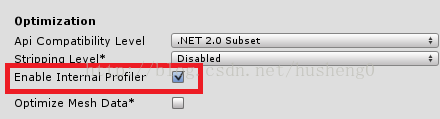
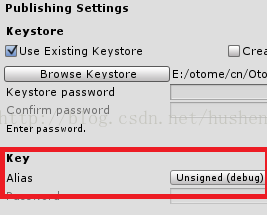
2、PlayerSetting
3、Profiler连接

Profiler:
1、CPU
①WaitForTargetFPS: Vsync(垂直同步),显示当前帧的CPU等待时间。
②Overhead:记录不明确的时间消耗。
③Physics.Simulate:当前帧物理模拟的CPU占用时间。
④Camera.Render:相机渲染准备工作的CPU占用量。
⑤RenderTexture.SetActive:设置RenderTexture操作。
⑥GUI.Repaint:GUI的重绘。
⑦Monobehaviour.OnMouse_:用于输入消息接收和反馈。
⑧Cleanup Unused Cached Data:清空无用的缓存数据。
2、Rendering
包括DrawCall、三角、顶点等等。
3、Memory
simple:显示内存总的信息。
①Used Total:当前帧的Unity内存、Mono内存、GfxDriver内存、Profiler内存的总和。
②Reserved Total:系统在当前帧的申请内存。
③Total System Memory Usage:当前帧的虚拟内存使用量.(通常是我们当前使用内存的1.5~3倍) 。
④GameObjects in Scene:当前帧场景中的GameObject数量。
⑤Total Objects in Scene:当前帧场景中的Object数量(除GameObject外,还有Component等)。
⑥Total Object Count:Object数据 + Asset数量。
detailed->Take Sample(Memory Usage in Editor is not as it would be in player)所以要用真机调试。
①Other:
ManagedHeap.UseSize:代码在运行时造成的堆内存分配,表示上次GC到目前为止所分配的堆内存量。
ManagedHeap.ReservedUnusedSize:当前保留的空闲托管内存。
SerializedFile
WebStream:这个是由WWW来进行加载的内存占用。
常见的主要是加载AssetBundle导致这部分产生内存占用,一般SerializedFile最少有0.25M以上,WebStream最少有0.1M以上,所以加载之后不用的AssetBundle要记得及时Unload(false)。
System.ExecutableAndDlls:不同平台和不同硬件得到的值会不一样。
GfxClientDevice:GFX(图形加速\图形加速器\显卡 (GraphicsForce Express))客户端设备。
②Scene Memory:即Hierarchy中能看到的。
③Assets:即真正占用内存的。
主要包括:Texture2D、Font、AnimationClip、AudioClip等等。
AudioManager:音频管理器,随着音频文件的增多而增大。
内存优化主要分析Asset中资源是否及时卸载,资源是否冗余等。
由于堆内存只增不减,所以要分析“尖峰”,尽量避免。
④Builtin Resources引擎的资源消耗,这个好像没办法。