安装环境:XAMPP版本号V3.1.0 ;phpStorm版本8.0.3;windowsxp 32bit。
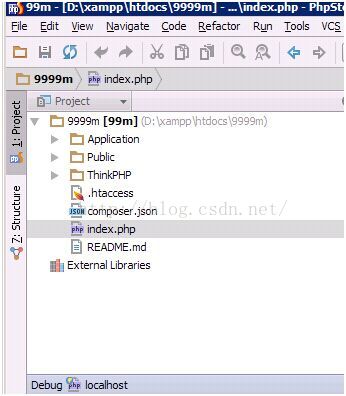
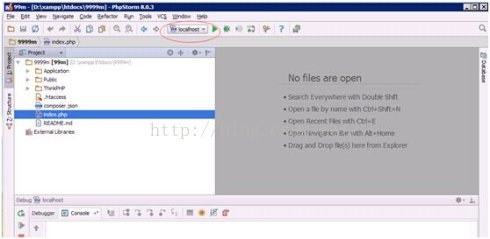
XAMPP、phpStorm 都直接安装在了D盘根目录,9999m目录建在D:\xampp\htocts下,即目录工程文件夹路径为D:\xampp\htocts\9999m。在phpStorm>File>open,找到9999m,点击确定,加载9999m到了phpStorm(安装环境路径根据需要自行更改,后面的配置内容也类似)。图1
在public下新建文件info.php输入内容:<?php phpinfo(); ?>
访问:localhost/999m/public/info.php查看php相关信息
查找xdebug,没找到,需要安装
安装xdebug: https://xdebug.org/download.php
版本选择:如果不知道需要下载哪个版本,可以在https://xdebug.org/download.php页面的Releases部分的链接installation instructions进行php版本分析找到对应的xdebug.
将localhost/999m/public/info.php获取的页面右键查看网页源代码,将源代码全选复制,粘贴到installation instructions页面,
现在php版本低于7就不能分析对应的xdebug 版本了。
按照操作步骤将下载的xdebug文件复制到xampp/php/ext下,
在安装目录下找到php.ini,类似于D:\xampp\php\php.ini文件,在尾部配置xdebug信息:
[XDebug]
zend_extension = "D:\xampp\php\ext\php_xdebug.dll"
xdebug.remote_enable = 1
xdebug.remote_handler = dbgp
xdebug.remote_mode = req
xdebug.remote_port = 9000
xdebug_remote_host = localhost
xdebug.idekey="PHPSTORM"
参考:
[XDebug]
zend_extension = "D:\xampp\php\ext\php_xdebug.dll"
xdebug.profiler_append = 0
xdebug.profiler_enable = 1
xdebug.profiler_enable_trigger = 0
xdebug.profiler_output_dir = "D:\xampp\tmp"
xdebug.profiler_output_name = "cachegrind.out.%t-%s"
xdebug.trace_output_dir = "D:\xampp\tmp"
xdebug.remote_enable = on
xdebug.remote_handler = "dbgp"
xdebug.remote_host = "127.0.0.1"
xdebug.idekey= PHPSTROM
其中remote_host 是指调试客户端的地址,即IDE所在的IP,同理remote_port 是客户端的端口,这两项在远程调试的情况下注意修改,远程的时候最终改为:
[XDebug]
zend_extension = "D:\xampp\php\ext\php_xdebug.dll"
xdebug.profiler_append = 0
xdebug.profiler_enable = 1
xdebug.profiler_enable_trigger = 0
xdebug.profiler_output_dir = "D:\xampp\tmp"
xdebug.profiler_output_name = "cachegrind.out.%t-%s"
xdebug.remote_enable = 1
xdebug.remote_handler = "dbgp"
xdebug.remote_mode = "req"
xdebug.remote_port = 9000
4. 保存文件,重新启动apache检查是否成功开启了xdebug服务。图3

一种方法为在CMD里输入D:\xampp\php\php.exe -m 看到XDebug,说明成功开启XDebug。图4

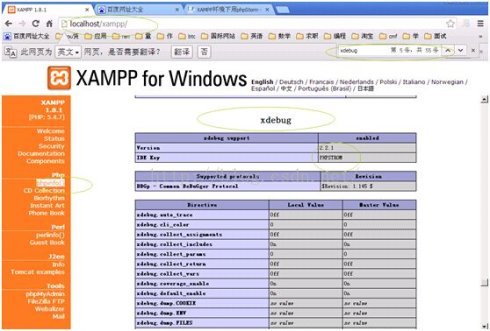
另一种方法为浏览器打开localhost,找到phpinfo()点击打开配置情况,查找xdebug项,找到了说明xdebug配置成功。图5
至此,服务器端配置完毕。
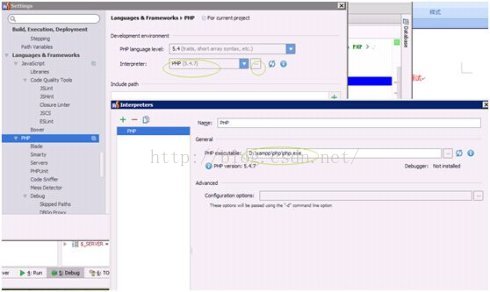
5. 下面是客户端调试。打开phpStorm,进入File>Settings>PHP,这里要interpreter浏览,填D:\xampp\php\php.exe,自动识别版本。图6
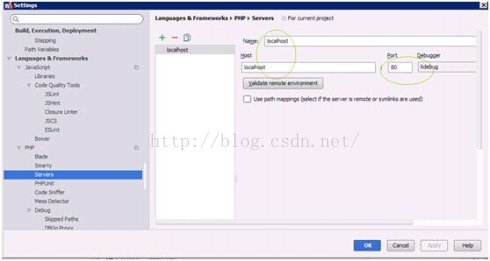
6. 进入File>Settings>PHP>Servers,这里要填写服务器端的相关信息,name填localhost,host填localhost,port填80,debugger选XDebug。图7
7. 进入File>Settings>PHP>Debug,看到XDebug选项卡,port填9000,其他默认。图8

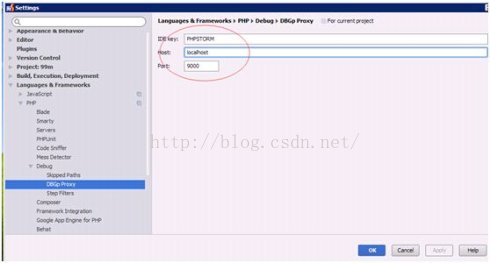
8. 进入File>Settings>PHP>Debug>DBGp Proxy,IDE key 填 PHPSTORM,host 填localhost,port填9000(填80也可以,自己试试吧),点OK退出设置。图9
9. 进入Run> Debug configurations,点+号,Server选填localhost,start url填http://localhost/9999m, Browse 填chrome,点OK退出设置。图10
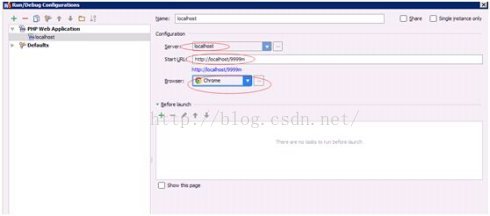
点OK退出设置之后,phpstorm运行按钮旁边自动填充localhost,且运行按钮由灰色被激活成为绿色。如果start url填的是http://localhost,没有填写9999m,则当点击phpstorm运行按钮,浏览器进入默认地址http://localhost,没办法直接访问http://localhost/9999m。图11
10. chrome浏览器链接配置。找到对应的插件,chrome的为phpstrom IDE Support chrome.crx,
IDE Support插件下载地址:http://www.cnplugins.com/down/predown.aspx?fn=1502/www.cnplugins.com_hmhgeddbohgjknpmjagkdomcpobmllji_2_0_7_.crx&aid=24955
xdebug插件下载地址:http://chromecj.com/web-development/2018-04/980/download.html
自己下载然后拖动文件到chrome设置>扩展程序。Chrome右上角增加了JB图标即为成功安装插件。图12

11. 在phpStorm里打开监听,就是一个电话一样的按钮,点击变为绿色,在程序代码点前点击,设置程序段点,点击绿色的debug爬虫按钮,chrome浏览器打开xdebug页,phpStorm出现debug窗口,并获取到variables值,即为看到下面的debug信息,说明成功配置。图13

参考:
http://blog.sina.com.cn/s/blog_65cee6990102vlb4.html
https://blog.csdn.net/qq_33862644/article/details/76677879