环境
phpstorm、phpstudy
配置
1、配置php中的xdebug,在php.ini中配置,用的哪个版本,就配置哪个,这里以5.4.5为例
php.ini中xdebug的配置,这是我配置的
[XDebug]
xdebug.auto_trace=1
xdebug.trace_format=0
xdebug.profiler_output_dir="F:\phpstudy\PHPTutorial\tmp\xdebug"
xdebug.trace_options=0
xdebug.collect_params=4
xdebug.collect_return=1
xdebug.collect_vars=1
xdebug.collect_assignments=1
xdebug.profiler_enable=1
xdebug.trace_output_dir="F:\phpstudy\PHPTutorial\tmp\xdebug"
zend_extension="F:\phpstudy\PHPTutorial\php\php-5.4.45\ext\php_xdebug.dll"

xdebug.remote_autostart = 0 ;
xdebug.remote_enable = 1 ;
xdebug.remote_handler = "dbgp";
xdebug.remote_host = "127.0.0.1";
xdebug.remote_port = 9000 ;
xdebug.idekey="PHPSTORM" ;
2、配置phpstorm,选择解释器的方法和pycharm差不多,之后普通的断点可以用了
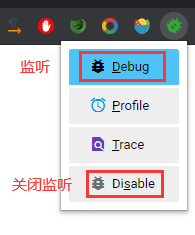
3、主要记录一下配置远程监控,要使用到Google的插件Xdebug helper
配置过程:
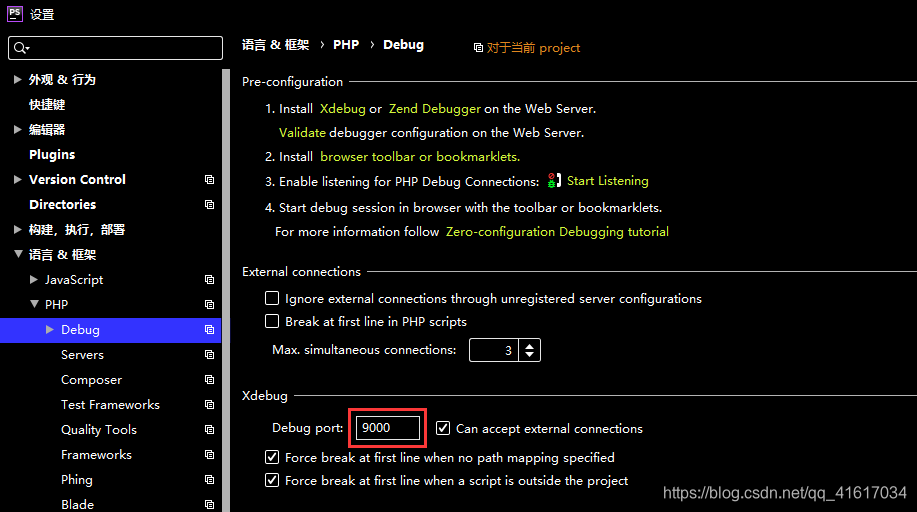
(1)配置phpstorm中的Debug
选择文件->设置->语言&框架->Debug->设置端口,默认9000
注:确定这里的端口和php.ini中是一样的
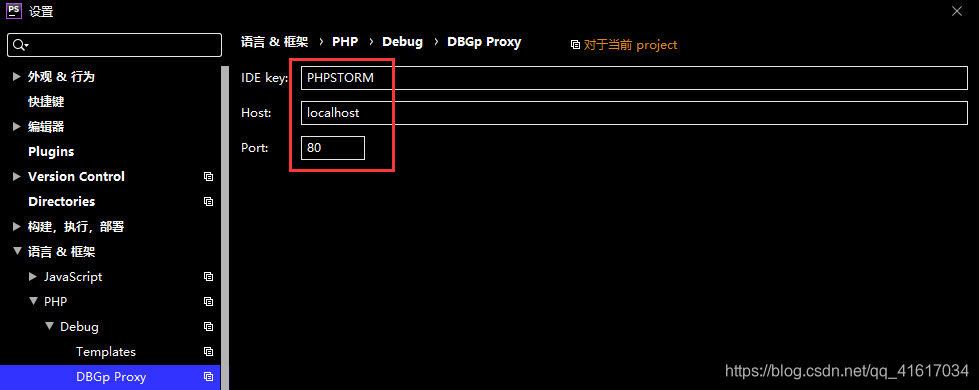
(2)配置DBGp Proxy
文件->设置->语言&框架->Debug->DBGp Proxy
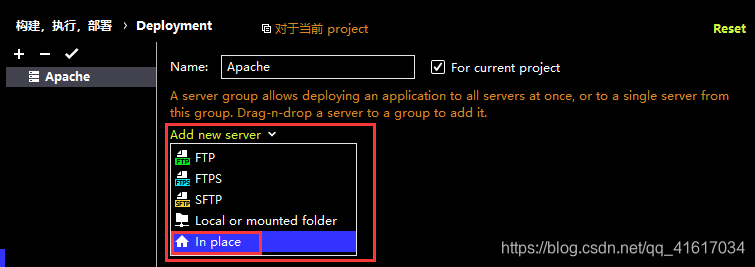
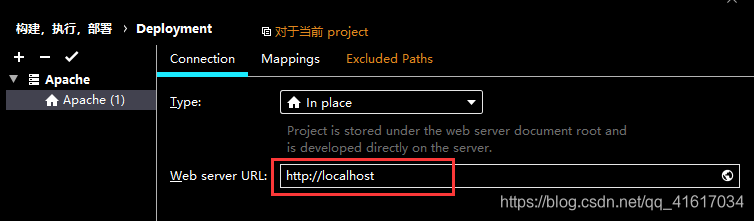
(3)使用phpstudy环境配置(如果不需要可可以不设置,默认使用phpstorm的64423端口)
我的Servers配置了端口没有用,无论怎样都是64233端口,所以只能使用下面的方法了,名称随意:
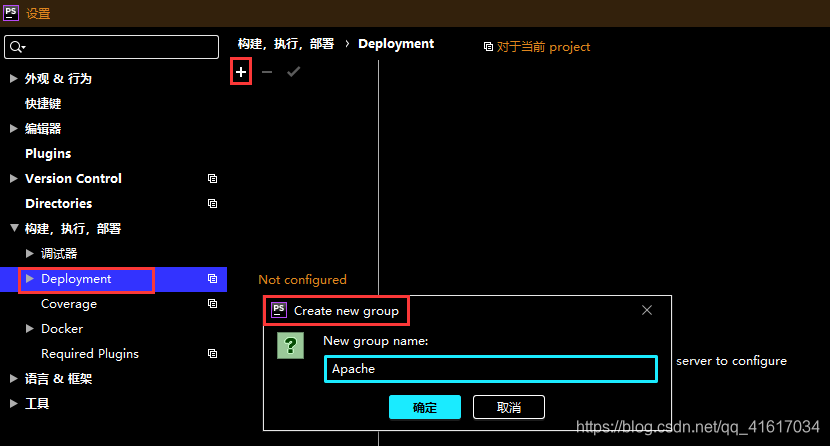
注意:配置这个后,在phpstorm内点击浏览器执行默认会使用本地phpstudy中www目录下的文件,所以如文中的1.php要在www目录下
(4)监听浏览器
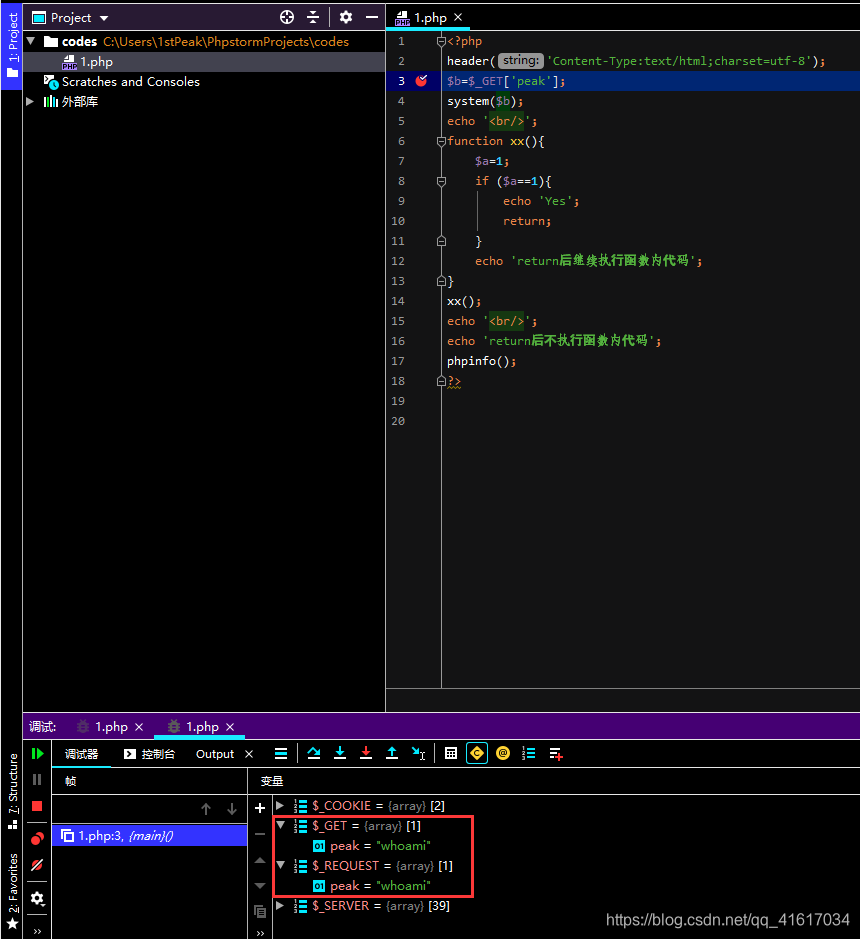
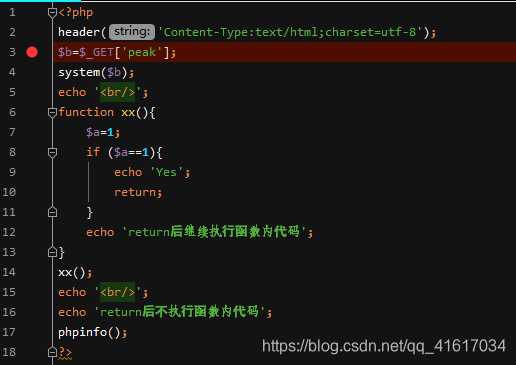
例如一串代码:
<?php
header('Content-Type:text/html;charset=utf-8');
$b=$_GET['peak'];
system($b);
echo '<br/>';
function xx(){
    $a=1;
    if ($a==1){
        echo 'Yes';
        return;
    }
    echo 'return后继续执行函数内代码';
}
xx();
echo '<br/>';
echo 'return后不执行函数内代码';
?>
怎么截取GET请求呢?如下
先设断点
打开监听(下图所示是关闭状态)
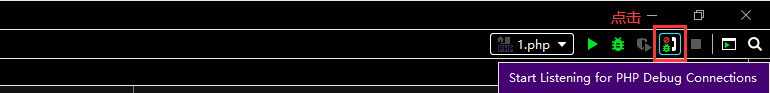
之后打开浏览器
打开监听,访问1.php