现实工作中的数据集往往会出现不均衡的情况,正例和反例的比例可能是1:9,在这种情况下,分类器往往无法达到良好的性能。
此时模型的评估不能只用sklearn中自带的"score"函数,还需要使用精度和召回率来衡量模型的性能。
此时需要单独设置一个参数“class_weight”。
在sklearn官方文档的说明中,给出了使用示例:
说明地址:http://scikit-learn.org/stable/auto_examples/svm/plot_separating_hyperplane_unbalanced.html#sphx-glr-auto-examples-svm-plot-separating-hyperplane-unbalanced-py
print(__doc__)

import numpy as np
import matplotlib.pyplot as plt
from sklearn import svm

# we create clusters with 1000 and 100 points
rng = np.random.RandomState(0)
n_samples_1 = 1000
n_samples_2 = 100
X = np.r_[1.5 * rng.randn(n_samples_1, 2),
          0.5 * rng.randn(n_samples_2, 2) + [2, 2]]
y = [0] * (n_samples_1) + [1] * (n_samples_2)

# fit the model and get the separating hyperplane
clf = svm.SVC(kernel='linear', C=1.0)
clf.fit(X, y)

# fit the model and get the separating hyperplane using weighted classes
wclf = svm.SVC(kernel='linear', class_weight={1: 10})
wclf.fit(X, y)

# plot separating hyperplanes and samples
plt.scatter(X[:, 0], X[:, 1], c=y, cmap=plt.cm.Paired, edgecolors='k')
plt.legend()

# plot the decision functions for both classifiers
ax = plt.gca()
xlim = ax.get_xlim()
ylim = ax.get_ylim()

# create grid to evaluate model
xx = np.linspace(xlim[0], xlim[1], 30)
yy = np.linspace(ylim[0], ylim[1], 30)
YY, XX = np.meshgrid(yy, xx)
xy = np.vstack([XX.ravel(), YY.ravel()]).T

# get the separating hyperplane
Z = clf.decision_function(xy).reshape(XX.shape)

# plot decision boundary and margins
a = ax.contour(XX, YY, Z, colors='k', levels=[0], alpha=0.5, linestyles=['-'])

# get the separating hyperplane for weighted classes
Z = wclf.decision_function(xy).reshape(XX.shape)

# plot decision boundary and margins for weighted classes
b = ax.contour(XX, YY, Z, colors='r', levels=[0], alpha=0.5, linestyles=['-'])

plt.legend([a.collections[0], b.collections[0]], ["non weighted", "weighted"],
           loc="upper right")
plt.show()
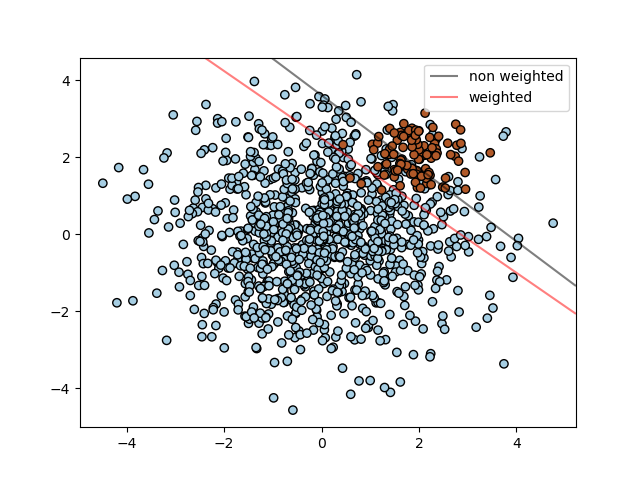
类似的道理,在不平衡的数据集上,不管用何种算法,都可以对“class_weight”这个参数进行设定,提高模型的性能。