1、背景
前端导出PPT,刚接触这个需求,还是比较懵逼,然后就在网上查找资料,最终确认是可行的;这个需求也是合理的,我们做了一个可视化数据报表,报表导出成PPT,将在线报表转成文档类型留存;
2、技术方案
实现这种复杂的功能,都得依赖前辈匠人,还好有一个比较完善好用的库:pptxgenjs
只有英文文档:Quick Start Guide | PptxGenJS,还可以搭配大家比较熟悉的库:html2canvas,更好的实现完善的PPT
3、PptxGenJS运用
引入,生成一个简单的PPT文档
import pptxgen from "pptxgenjs";

let pptx = new pptxgen();

let slide = pptx.addSlide();

slide.addText("React Demo!", { x: 1, y: 1, w: 10, fontSize: 36, fill: { color: "F1F1F1" }, align: "center" });

pptx.writeFile({ fileName: "react-demo.pptx" }
pptx全局属性:
pptx.author = 'Brent Ely';
pptx.company = 'S.T.A.R. Laboratories';
pptx.revision = '15';
pptx.subject = 'Annual Report';
pptx.title = 'PptxGenJS Sample Presentation';
pptx.layout = 'LAYOUT_WIDE'; //13.5 x 7.5
其中最重要的属性,layout,顾名思义,就是设置PPT的slide的大小,默认就下面几种:
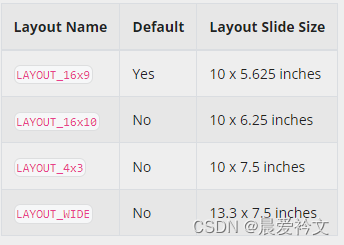
还可以自定义。这个x*y,是后面PPT页计算布局必不可少的;
slide master,自定义PPT页模板:
    ppt.defineSlideMaster({
      title: 'DEFAULT_SLIDE',
      objects: [
        { image: { x: 0.25, y: 0.3, w: 0.6, h: 0.6, path: path} },
        { image: { x: 10.8, y: 0.61, w: 1.485, h: 0.166, path: path} },
        { image: { x: 12.3, y: 0.52, w: 0.72, h: 0.36, path: path} },
        { line: { x: 0.25, y: 1, w: 12.8, h: 0, line: { color: '3874c5', width: 2 } } },
        { image: { path: path, x: 0, y: 7.2, w: '100%', h: 0.3, size: { type: 'cover' } } },
      ],
    });
我们自己创建PPT时,也会引用模板,这个就是自定义模板,就避免每页都设置;
slide,PPT页属性对象:

创建一页PPT,addSilde({masterName});masterName就是上面自定义的模板,就是上面的DEFAULT_SLIDE
4、添加表格
表格是一个常用功能,PPT的表格也比较完善,addTable();
表头和合计,这个pptx没有特殊的处理,只能作为正常row处理;
行高度问题row Height,表格设置高度h,如果不设置行高,rowH,这样表格会填充h,设置了rowH,最小高度会按rowH设置值显示;
表格一般有比较多的数据,PPT页就那么高,肯定会有超出PPT页的情况,pptx支持自定义分页,autoPage:true,然后结合autoPageCharWeight,autoPageLineWeight调试分页,在实际使用过程发现自动分页也是根据你设置的rowH和H来计算的,对表格单元格多行,还是会超出,然后导出的ppt文档,会报错,要修复啥的,所以我选择手动给它分页;
列宽问题,默认是等分的,colW,实际开发是最好根据列的宽度,然后计算colW的,记住设置了colW了,表格会严格按照设置的值展示,不会自适应,所以还要程序根据w在计算;
  setTable(data, option = {}) {
    let row = [];
    let options = { fontFace: 'Microsoft YaHei', fontSize: 12, margin: 0.05, valign: 'middle', align: 'left' };
    options['border'] = [{ pt: 1, color: 'ffffff', type: 'dash' }, { type: 'none' }, { pt: 1, color: 'ffffff', type: 'dash' }, { type: 'none' }];
    let head = [];
    let colW = [];
    data.head.forEach(item => {
      head.push({ text: item.label, options: { ...options, fill: '1E4265', color: 'ffffff' } });
      if (item.width < 85) {
        colW.push(0.1);
      } else if (item.width < 101) {
        colW.push(0.2);
      } else if (item.width < 121) {
        colW.push(0.3);
      } else {
        colW.push(0.4);
      }
    });
    // autoPage: true, newSlideStartY: 1.1, autoPageRepeatHeader: true,暂时自动分页不太行
    let page = { ...this.page, rowH: 0.5, valign: 'middle' };
    // 表格超出,ppt分页展示,最多展示三页数据
    let tableData = data.table || [];
    tableData = tableData.slice(0, 30);
    tableData.forEach((item, index) => {
      let temp = [];
      let fill = index % 2 == 1 ? 'ffffff' : 'f2f2f2';
      data.head.forEach(h => {
        temp.push({ text: item[h.prop] === null ? '' : item[h.prop], options: { ...options, fill } });
      });
      row.push(temp);
    });
    let sumW = colW.reduce((per, cur) => per + cur, 0);
    let fNum = option.h < 6 ? 5 : 10;
    let fRow = row.slice(0, fNum);
    let fOption = { ...page, ...option };
    fOption['colW'] = colW.map(item => Number((fOption.w / sumW) * item).toFixed(1));
    this.slide.addTable([head, ...fRow], fOption);
    let eNum = parseInt(fNum + 10);
    let tRow = row.slice(fNum, eNum);
    if (tRow.length) {
      // 第二页
      let slide = this.ppt.addSlide({ masterName: 'DEFAULT_SLIDE' });
      page['colW'] = colW.map(item => Number((page.w / sumW) * item).toFixed(1));
      slide.addTable([head, ...tRow], { ...page });
      tRow = row.slice(eNum, parseInt(eNum + 10));
      if (tRow.length) {
        // 第三页
        let slide = this.ppt.addSlide({ masterName: 'DEFAULT_SLIDE' });
        slide.addTable([head, ...tRow], { ...page });
      }
    }
  }
5、添加Image
addImage(),支持两种格式:data,base64数据;path,图片地址;注意,根据img的大小,然后换算实际的w和h;
  setChart(data, option = {}) {
    const { chartW, chartH, chartData } = data;
    let options = { ...this.page, ...option, sizing: { type: 'contain' } };
    let temp = (options.w / chartW) * chartH;
    if (temp > options.h) {
      temp = (options.h / chartH) * chartW;
      options.x = options.x + (options.w - temp) / 2;
      options.w = temp;
    } else {
      options.y = options.y + (options.h - temp) / 2;
      options.h = temp;
    }
    this.slide.addImage({ data: chartData, ...options });
}复杂的html,可以通过html2canvas,把dom转成图片添加PPT
  async setDom2Image(dom, option = {}) {
    let result = {};
    const res = await html2Canvas(dom, { scale: 2 });
    result['chartData'] = res.toDataURL('image/jpeg', 1);
    result['chartH'] = res.height;
    result['chartW'] = res.width;
    this.setChart(result, option);
  }
6、添加文本
添加文本,这个介绍把一段html,添加成PPT文本
  setContent(content, option = {}) {
    let obj = [];
    content &&
      content.forEach(item => {
        let len = item.children.length;
        --len;
        item.children.forEach((cItem, index) => {
          obj.push({ text: cItem.text, options: { bold: cItem.bold ? true : false, color: cItem.color ? this.RGBToHex(cItem.color) : '333333', breakLine: index === len } });
        });
      });
    let options = { ...this.page, ...option, align: 'left' };
    if (options.h == 6) {
      options['fontSize'] = options.h == 6 ? 16 : 12;
    }
    this.setTitle(obj, { ...options });
  }
  setTitle(text, option = {}) {
    const options = {
      fontSize: 12, //字号
      fontFace: 'Microsoft YaHei',
      bold: false,
      color: '333333', //颜色 与背景颜色一样,一样不要 #,填满6位
      valign: 'middle', // 垂直居中 top middle bottom
    };
    this.slide.addText(text, { ...options, ...option });
  }
由于PPT只支持16进制的颜色值,所以需要把rgb转成6位颜色值
  RGBToHex(rgb) {
    let regexp = /\d+/g;
    let res = rgb.match(regexp);
    return ((res[0] << 16) | (res[1] << 8) | res[2]).toString(16);
  }
把html转成slate的JSON
let document = new DOMParser().parseFromString(this.content, 'text/html');
result['json'] = this.deserialize(document.body);
deserialize(el, markAttributes = {}) {
if (el.nodeType === Node.TEXT_NODE) {
return jsx('text', markAttributes, el.textContent);
} else if (el.nodeType !== Node.ELEMENT_NODE) {
return null;
}
const nodeAttributes = { ...markAttributes };
// define attributes for text nodes
switch (el.nodeName) {
case 'STRONG':
nodeAttributes.bold = true;
}
// font color
if (el.style.color) {
nodeAttributes.color = el.style.color;
}
const children = Array.from(el.childNodes)
.map(node => this.deserialize(node, nodeAttributes))
.flat();
if (children.length === 0) {
children.push(jsx('text', nodeAttributes, ''));
}
switch (el.nodeName) {
case 'BR':
return '\n';
case 'P':
return jsx('element', { type: 'paragraph' }, children);
default:
return children;
}
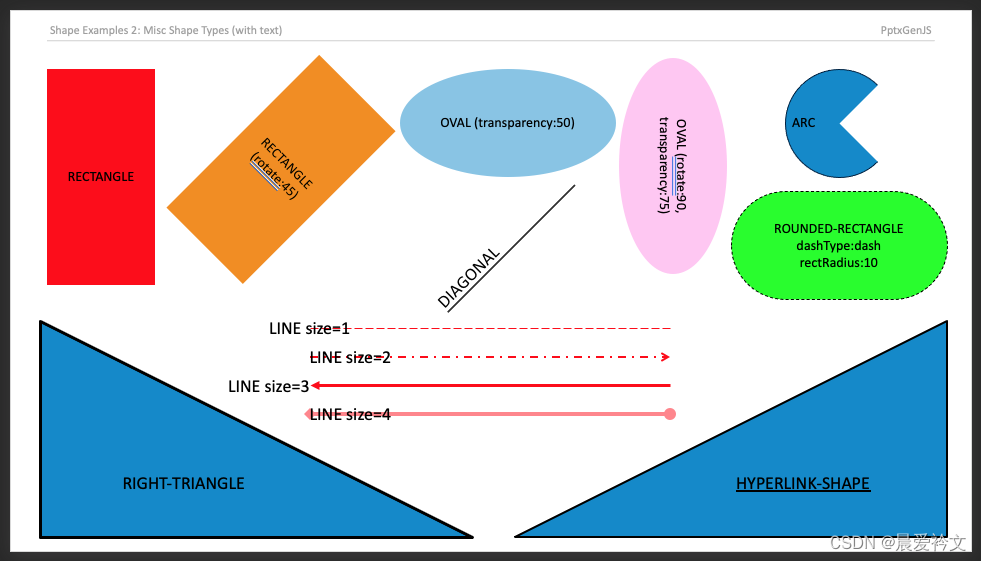
},7、绘制图形Shapes
shapes,绘制图形,文档有详细介绍,这里我就不累述
 8、总结
8、总结
整个功能实现下来还是比较耗时,主要文档都是英文,有些字段描述也不是很清晰,有的需要慢慢调试,上面一些介绍的功能,都是实际开发在使用的;总体来说,还是比较完美实现自定义导出PPT。欢迎大家一起沟通交流!!!