继续跟着b站pink老师学习 Echarts的开发
饼状图1 ——年龄分布
1.引入饼状图
ECharts 实例 直接打开网站 就是选好的饼状图的网址
//饼形图1 模块制作
(function () {
  // 实例化对象
  var myChart = echarts.init(document.querySelector(".pie .chart"));
  // 指定配置项和数据
  var option = {
    tooltip: {
      trigger: "item",
    },
    legend: {
      top: "5%",
      left: "center",
    },
    series: [
      {
        name: "Access From",
        type: "pie",
        radius: ["40%", "70%"],
        avoidLabelOverlap: false,
        label: {
          show: false,
          position: "center",
        },
        labelLine: {
          show: false,
        },
        data: [
          { value: 1048, name: "Search Engine" },
          { value: 735, name: "Direct" },
          { value: 580, name: "Email" },
          { value: 484, name: "Union Ads" },
          { value: 300, name: "Video Ads" },
        ],
      },
    ],
  };
  // 把配置项给实例对象
  myChart.setOption(option);
})();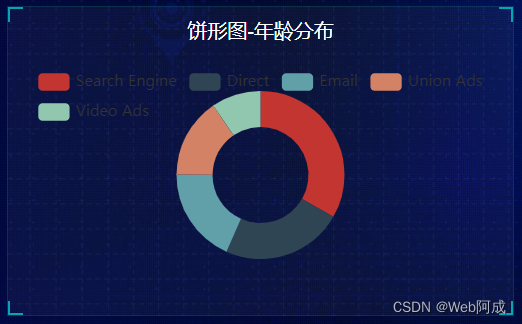
2.定制开发饼形图
//饼形图1 模块制作
(function () {
  // 实例化对象
  var myChart = echarts.init(document.querySelector(".pie .chart"));
  // 指定配置项和数据
  var option = {
    // 颜色
    color: ["#065aab", "#066eab", "#0682ab", "#0696ab", "#06a0ab"],
    tooltip: {
      trigger: "item",
    },
    // 修改图例组件
    legend: {
      bottom: "0%",
      // 修改小图标的大小
      itemWidth: 10,
      itemHeight: 10,
      textStyle: {
        color: "rgba(255,255,255,.5)",
        fontSize: 12,
      },
    },
    series: [
      {
        name: "年龄分布",
        type: "pie",
        // 设置饼形图在容器中的位置
        center: ["50%", "45%"],
        // 修改饼形图得大小,第一个是内圆的半径,第二个是外圆的半径
        radius: ["40%", "60%"],
        avoidLabelOverlap: false,
        // 不显示标签文字
        label: {
          show: false,
          // 标签文字得位置
          position: "center",
        },
        // 不显示连接线
        labelLine: {
          show: false,
        },
        // 更换数据
        data: [
          { value: 1, name: "0岁以下" },
          { value: 4, name: "20-29岁" },
          { value: 2, name: "30-39岁" },
          { value: 2, name: "40-49岁" },
          { value: 1, name: "50岁以上" },
        ],
      },
    ],
  };
  // 把配置项给实例对象
  myChart.setOption(option);

  // 侦听屏幕的变化,让图表跟着变化
  window.addEventListener("resize", function () {
    myChart.resize();
  });
})();

饼状图2 ——地区分布
1.引入饼状图
//饼形图2
(function () {
  // 实例化对象
  var myChart = echarts.init(document.querySelector(".pie2 .chart"));
  // 配置数据
  var option = {
    tooltip: {
      trigger: "item",
      formatter: "{a} <br/>{b} : {c} ({d}%)",
    },
    legend: {
      left: "center",
      top: "bottom",
      data: [
        "rose1",
        "rose2",
        "rose3",
        "rose4",
        "rose5",
        "rose6",
        "rose7",
        "rose8",
      ],
    },
    series: [
      {
        name: "Area Mode",
        type: "pie",
        radius: [20, 140],
        center: ["75%", "50%"],
        roseType: "area",
        itemStyle: {
          borderRadius: 5,
        },
        data: [
          { value: 30, name: "rose 1" },
          { value: 28, name: "rose 2" },
          { value: 26, name: "rose 3" },
          { value: 24, name: "rose 4" },
          { value: 22, name: "rose 5" },
          { value: 20, name: "rose 6" },
          { value: 18, name: "rose 7" },
          { value: 16, name: "rose 8" },
        ],
      },
    ],
  };
  // 构建
  myChart.setOption(option);
})();
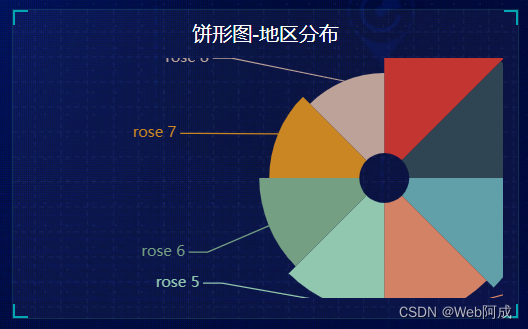
2.定制化开发
//饼形图2
(function () {
// 1. 实例化对象
var myChart = echarts.init(document.querySelector(".pie2 .chart"));
// 2. 指定配置项和数据
var option = {
legend: {
top: "90%",
itemWidth: 10,
itemHeight: 10,
textStyle: {
color: "rgba(255,255,255,.5)",
fontSize: "12",
},
},
tooltip: {
trigger: "item",
formatter: "{a} <br/>{b} : {c} ({d}%)",
},
// 注意颜色写的位置
color: [
"#006cff",
"#60cda0",
"#ed8884",
"#ff9f7f",
"#0096ff",
"#9fe6b8",
"#32c5e9",
"#1d9dff",
],
series: [
{
name: "点位统计",
type: "pie",
// 如果radius是百分比则必须加引号
radius: ["10%", "70%"],
center: ["50%", "42%"],
roseType: "radius",
data: [
{ value: 20, name: "云南" },
{ value: 26, name: "北京" },
{ value: 24, name: "山东" },
{ value: 25, name: "河北" },
{ value: 20, name: "江苏" },
{ value: 25, name: "浙江" },
{ value: 30, name: "深圳" },
{ value: 42, name: "广东" },
],
// 修饰饼形图文字相关的样式 label对象
label: {
fontSize: 10,
},
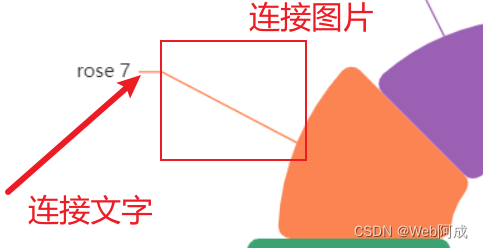
// 修饰引导线样式
labelLine: {
// 连接到图形的线长度
length: 10,
// 连接到文字的线长度
length2: 10,
},
},
],
};
// 3. 配置项和数据给我们的实例化对象
myChart.setOption(option);
// 4. 当我们浏览器缩放的时候,图表也等比例缩放
window.addEventListener("resize", function () {
// 让我们的图表调用 resize这个方法
myChart.resize();
});
})();
注意: 在饼状图中 series的labelLine属性中 有两个值 length 和 length2 分别代表连接图形的线条和连接文字的线条 直接看下图