本文网址为https://blog.csdn.net/weixin_43483799/article/details/118885208,转载请保留此信息,以确保读者可以追踪本文在未来的更新信息。
前言
请先阅读pwntools官方issues,确保其他人的回答仍无法解决问题:
docker gdb attach #1140
长文不看版:
首先使用pwn version确认你的pwntools版本。如果是4.6.0及之前的版本,都存在这个问题。若如此,找个目录下载一下最新的版本:git clone --depth 1 git://github.com/Gallopsled/pwntools,然后不需要cd切换目录,直接使用pip install --upgrade --editable ./pwntools。这条语句会自动卸载当前pwntools并安装开发版本。Waiting for debugger无限等待的问题在这篇博客发表4天前(2021-7-15)刚被修复……
背景
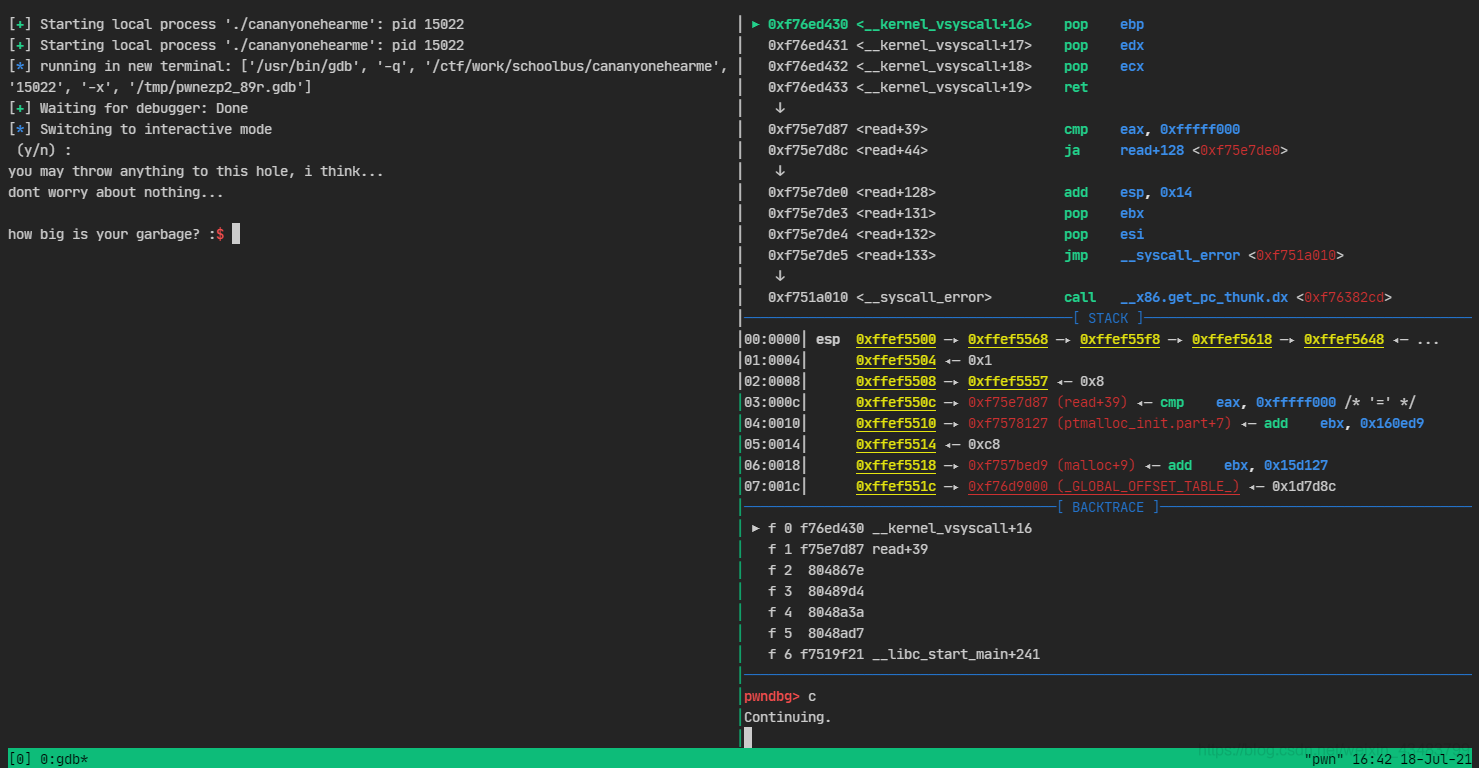
使用ssh连接centos服务器,用着c01dkit/pwndocker的pwndocker,开了tmux的情况下,使用context.terminal = ['tmux','splitw','-h']和gdb.attach(xxxx)出现Waiting for debugger,然后无限等待,即便gdb正常attach到了程序上。截图如下:
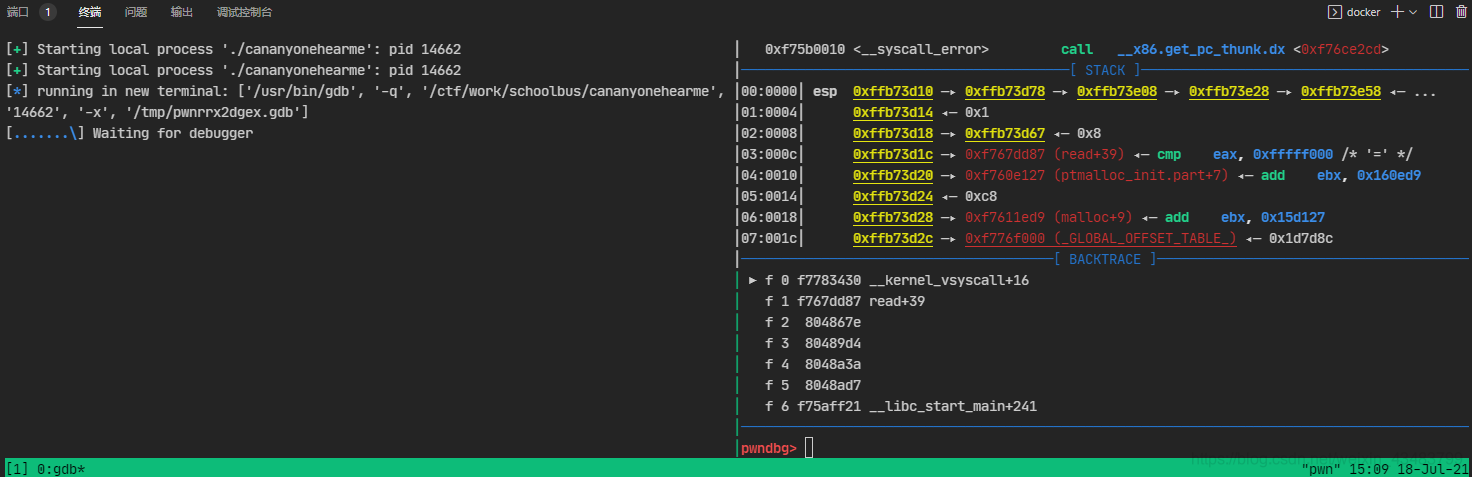
正常情况下,如果debugger在15s内没有return的话程序会报一个failure。但是这里无论等多久都没有返回。
解决思路
调试发现,这是由于/usr/local/lib/python3.6/dist-packages/pwnlib/util/proc.py的 wait_for_debugger函数在
while t.timeout and tracer(pid) is None:
这个循环中无限执行了。通过在这个while外面加上调试语句可以发现,这里源码的问题在于countdown不会按照预想的方式进行倒计时,所以造成无限循环。
有兴趣可以阅读一下/usr/local/lib/python3.6/dist-packages/pwnlib/timeout.py对于倒计时的实现,此处就不从改timeout下手了(因为要解决的不是无限循环,是解决造成无限循环的原因)
tracer
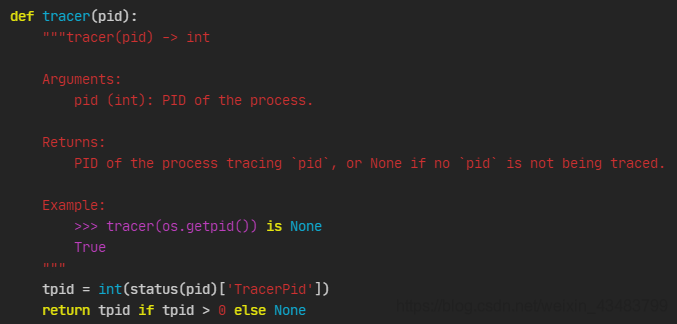
进一步调试(在控制台运行一个程序,ps -aux查看其pid,并使用pwntools的pwnlib.util下proc.py的tracer函数手动查看pid的信息)发现tracer函数存在问题。在背景提到的环境下,该函数的返回值一直都是None。该函数实现如下(在/usr/local/lib/python3.6/dist-packages/pwnlib/util/proc.py中):
status
其调用的status也在这个文件里,实现方式如下:
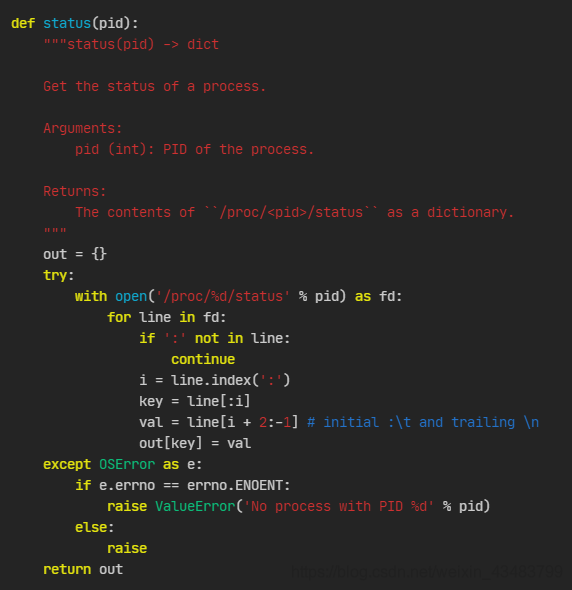
可见它是去/proc/<pid>/status查看具体信息,然后把它做成字典并返回。然后tracer函数从字典中提取TracerPid字段,以查看该二进制程序到底有没有被gdb追踪到。这里举一个/proc/14792/status文件的例子(是buuctf的一道题)。注意status文件里的TracerPid字段是0,因为没有开启gdb调试。
#运行程序后,先ps -aux一下
root@pwn:/usr/local/lib/python3.6/dist-packages/pwnlib/util# ps -aux
USER       PID %CPU %MEM    VSZ   RSS TTY      STAT START   TIME COMMAND
root         1  0.0  0.0  21764  2000 pts/0    Ss+  Jul17   0:00 bash
root     13799  0.0  0.0  21884  2268 pts/1    Ss+  02:39   0:00 /bin/bash
root     14375  0.0  0.0  21888  2312 pts/2    Ss   13:39   0:00 /bin/bash
root     14390  0.0  0.0  21888  2320 pts/3    Ss   13:39   0:00 /bin/bash
root     14792  0.0  0.0   4504   384 pts/3    S+   15:51   0:00 ./bjdctf_2020_babystack
root     14795  0.1  0.0  21896  2212 pts/4    Ss+  15:52   0:00 /bin/bash
root     14811  0.0  0.0  37660  1572 pts/2    R+   15:53   0:00 ps -aux
# 然后查看该文件的status
root@pwn:/usr/local/lib/python3.6/dist-packages/pwnlib/util# cat /proc/14792/status
Name:   bjdctf_2020_bab
Umask:  0022
State:  S (sleeping)
Tgid:   14792
Ngid:   0
Pid:    14792
PPid:   14390
TracerPid:      0
Uid:    0       0       0       0
Gid:    0       0       0       0
FDSize: 256
Groups:
VmPeak:     4504 kB
VmSize:     4504 kB
VmLck:         0 kB
VmPin:         0 kB
VmHWM:       384 kB
VmRSS:       384 kB
RssAnon:              64 kB
RssFile:             320 kB
RssShmem:              0 kB
VmData:      168 kB
VmStk:       132 kB
VmExe:         4 kB
VmLib:      2112 kB
VmPTE:        36 kB
VmSwap:        0 kB
Threads:        1
SigQ:   0/127718
SigPnd: 0000000000000000
ShdPnd: 0000000000000000
SigBlk: 0000000000000000
SigIgn: 0000000000000000
SigCgt: 0000000000000000
CapInh: 0000001fffffffff
CapPrm: 0000001fffffffff
CapEff: 0000001fffffffff
CapBnd: 0000001fffffffff
CapAmb: 0000000000000000
NoNewPrivs:     0
Seccomp:        0
Speculation_Store_Bypass:       thread vulnerable
Cpus_allowed:   00ffffff
Cpus_allowed_list:      0-23
Mems_allowed:   00000000,00000000,00000000,00000000,00000000,00000000,00000000,00000000,00000000,00000000,00000000,00000000,00000000,00000000,00000000,00000000,00000000,00000000,00000000,00000000,00000000,00000000,00000000,00000000,00000000,00000000,00000000,00000000,00000000,00000000,00000000,00000003
Mems_allowed_list:      0-1
voluntary_ctxt_switches:        1
nonvoluntary_ctxt_switches:     1
然后再开一个窗口,使用gdb -p 14792来追踪这个程序,结果如下:
#这里已经attach了一个gdb,看一下程序运行情况
root@pwn:/usr/local/lib/python3.6/dist-packages/pwnlib/util# ps -aux
USER       PID %CPU %MEM    VSZ   RSS TTY      STAT START   TIME COMMAND
root         1  0.0  0.0  21764  2000 pts/0    Ss+  Jul17   0:00 bash
root     13799  0.0  0.0  21884  2268 pts/1    Ss+  02:39   0:00 /bin/bash
root     14375  0.0  0.0  21888  2312 pts/2    Ss   13:39   0:00 /bin/bash
root     14390  0.0  0.0  21888  2320 pts/3    Ss   13:39   0:00 /bin/bash
root     14792  0.0  0.0   4504   400 pts/3    t+   15:51   0:00 ./bjdctf_2020_babystack
root     14795  0.0  0.0  21896  2212 pts/4    Ss   15:52   0:00 /bin/bash
root     14812  7.5  0.1 180148 65140 pts/4    S+   15:53   0:01 gdb -p 14792
root     14819  0.0  0.0  37660  1568 pts/2    R+   15:53   0:00 ps -aux
#然后再看一下status
root@pwn:/usr/local/lib/python3.6/dist-packages/pwnlib/util# cat /proc/14792/status
Name:   bjdctf_2020_bab
Umask:  0022
State:  t (tracing stop)
Tgid:   14792
Ngid:   0
Pid:    14792
PPid:   14390
TracerPid:      14812  #这里已经更新,变成了gdb的pid。
Uid:    0       0       0       0
Gid:    0       0       0       0
FDSize: 256
Groups:
VmPeak:     4504 kB
VmSize:     4504 kB
VmLck:         0 kB
VmPin:         0 kB
VmHWM:       400 kB
VmRSS:       400 kB
RssAnon:              64 kB
RssFile:             336 kB
RssShmem:              0 kB
VmData:      168 kB
VmStk:       132 kB
VmExe:         4 kB
VmLib:      2112 kB
VmPTE:        36 kB
VmSwap:        0 kB
Threads:        1
SigQ:   0/127718
SigPnd: 0000000000000000
ShdPnd: 0000000000000000
SigBlk: 0000000000000000
SigIgn: 0000000000000000
SigCgt: 0000000000000000
CapInh: 0000001fffffffff
CapPrm: 0000001fffffffff
CapEff: 0000001fffffffff
CapBnd: 0000001fffffffff
CapAmb: 0000000000000000
NoNewPrivs:     0
Seccomp:        0
Speculation_Store_Bypass:       thread vulnerable
Cpus_allowed:   00ffffff
Cpus_allowed_list:      0-23
Mems_allowed:   00000000,00000000,00000000,00000000,00000000,00000000,00000000,00000000,00000000,00000000,00000000,00000000,00000000,00000000,00000000,00000000,00000000,00000000,00000000,00000000,00000000,00000000,00000000,00000000,00000000,00000000,00000000,00000000,00000000,00000000,00000000,00000003
Mems_allowed_list:      0-1
voluntary_ctxt_switches:        2
nonvoluntary_ctxt_switches:     1
所以tracer函数的本质就是从系统文件中读取信息,看看哪个程序正在追踪这个程序。然后经过在python文件中添加调试语句并使用相同的方法进行查看,发现确实可以获得tracer pid的。这里的wait_for_debugger函数使用了0.1s一次的检查。(本来以为是这种方法拿不到tracer pid,后来发现确实可以嗷。运行冲程序的前几次是None,之后就是正常的pid了。)
真正原因
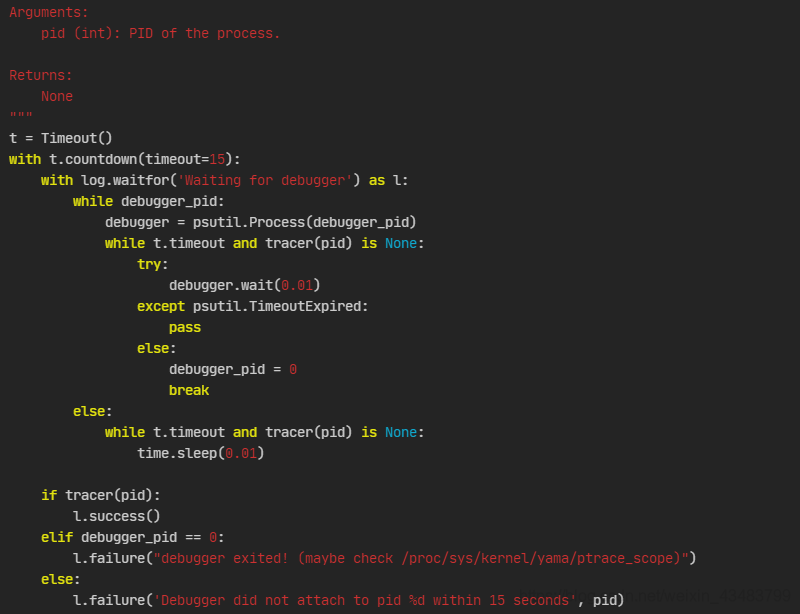
仔细观察程序,发现是程序逻辑设计有问题……即便是拿到了正确的pid,wait_for_debugger也会进入死循环。超时退出还好,也不知道为什么超时坏了退出不了(hhh)
简单来说while debugger_pid:这个循环是无法退出的,因为一切正常时debugger_pid = 0不会执行,所以这个就死循环了啊喂!
#/usr/local/lib/python3.6/dist-packages/pwnlib/util/proc.py

def wait_for_debugger(pid, debugger_pid=None):
    """wait_for_debugger(pid, debugger_pid=None) -> None

    Sleeps until the process with PID `pid` is being traced.
    If debugger_pid is set and debugger exits, raises an error.

    Arguments:
        pid (int): PID of the process.

    Returns:
        None
    """
    t = Timeout()
    with t.countdown(timeout=15):
        with log.waitfor('Waiting for debugger') as l:
            while debugger_pid:
                debugger = psutil.Process(debugger_pid)
                while t.timeout and tracer(pid) is None:
                    try:
                        debugger.wait(0.01)
                    except psutil.TimeoutExpired:
                        pass
                    else:
                        debugger_pid = 0
                        break
            else:
                while t.timeout and tracer(pid) is None:
                    time.sleep(0.01)

        if tracer(pid):
            l.success()
        elif debugger_pid == 0:
            l.failure("debugger exited! (maybe check /proc/sys/kernel/yama/ptrace_scope)")
        else:
            l.failure('Debugger did not attach to pid %d within 15 seconds', pid)
绕了半天,最后终于发现了死循环的原因。
解决方案
那么稍微修改一下源码即可。即找到了tracer就不用在while了,直接退出循环就完事了~
vim /usr/local/lib/python3.6/dist-packages/pwnlib/util/proc.py,然后把wait_for_debugger函数换成下面这个。(其实只改动了一小点,所以手动修改两三行就行)
#/usr/local/lib/python3.6/dist-packages/pwnlib/util/proc.py

def wait_for_debugger(pid, debugger_pid=None):
    """wait_for_debugger(pid, debugger_pid=None) -> None

    Sleeps until the process with PID `pid` is being traced.
    If debugger_pid is set and debugger exits, raises an error.

    Arguments:
        pid (int): PID of the process.

    Returns:
        None
    """
    t = Timeout()
    with t.countdown(timeout=15):
        with log.waitfor('Waiting for debugger') as l:
            while debugger_pid:
                debugger = psutil.Process(debugger_pid)
                #while t.timeout and tracer(pid) is None:
                if tracer(pid) is not None: break
                try:
                    debugger.wait(0.01)
                except psutil.TimeoutExpired:
                    pass
                else:
                    debugger_pid = 0
            else:
                while t.timeout and tracer(pid) is None:
                    time.sleep(0.01)

        if tracer(pid):
            l.success()
        elif debugger_pid == 0:
            l.failure("debugger exited! (maybe check /proc/sys/kernel/yama/ptrace_scope)")
        else:
            l.failure('Debugger did not attach to pid %d within 15 seconds', pid)
最终效果
如下图,waiting for debugger的死循环解决了!
总结
dl们写的代码也会存在问题……不要盲目搞崇拜呀。本来打算提交一个issue,但是发现github上不了了,就改天再说吧。
2021-7-19日补充:今天上了github,发现这个bug四天前被修复过了……好吧T_T