目录
前言
因为上文中提到的需求就是在 vue2 里面绘制echarts,所以,这里就搭建一个 vue2 的脚手架了。
想要深入了解 echarts 属性,请到此篇文章:如何用echarts画一个好看的饼图
至于如何在 vue2 中使用 echarts,请见这篇文章:https://blog.csdn.net/m0_54355172/article/details/131960527
1. 项目搭建
1.1. 前端
-
先搭建一个 vue2.0 的脚手架
-
安装vue-cli
-
卸载老版本
npm uninstall vue-cli -g -
安装脚手架
npm install -g @vue/cli
-
-
新建一个 vue2 的项目
vue create pie_front
-
-
引入 echarts 依赖:见博客:https://blog.csdn.net/m0_54355172/article/details/131960527
-
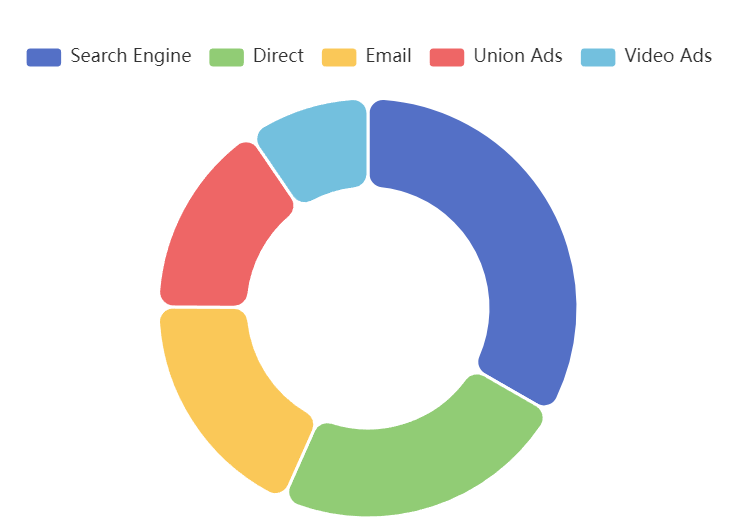
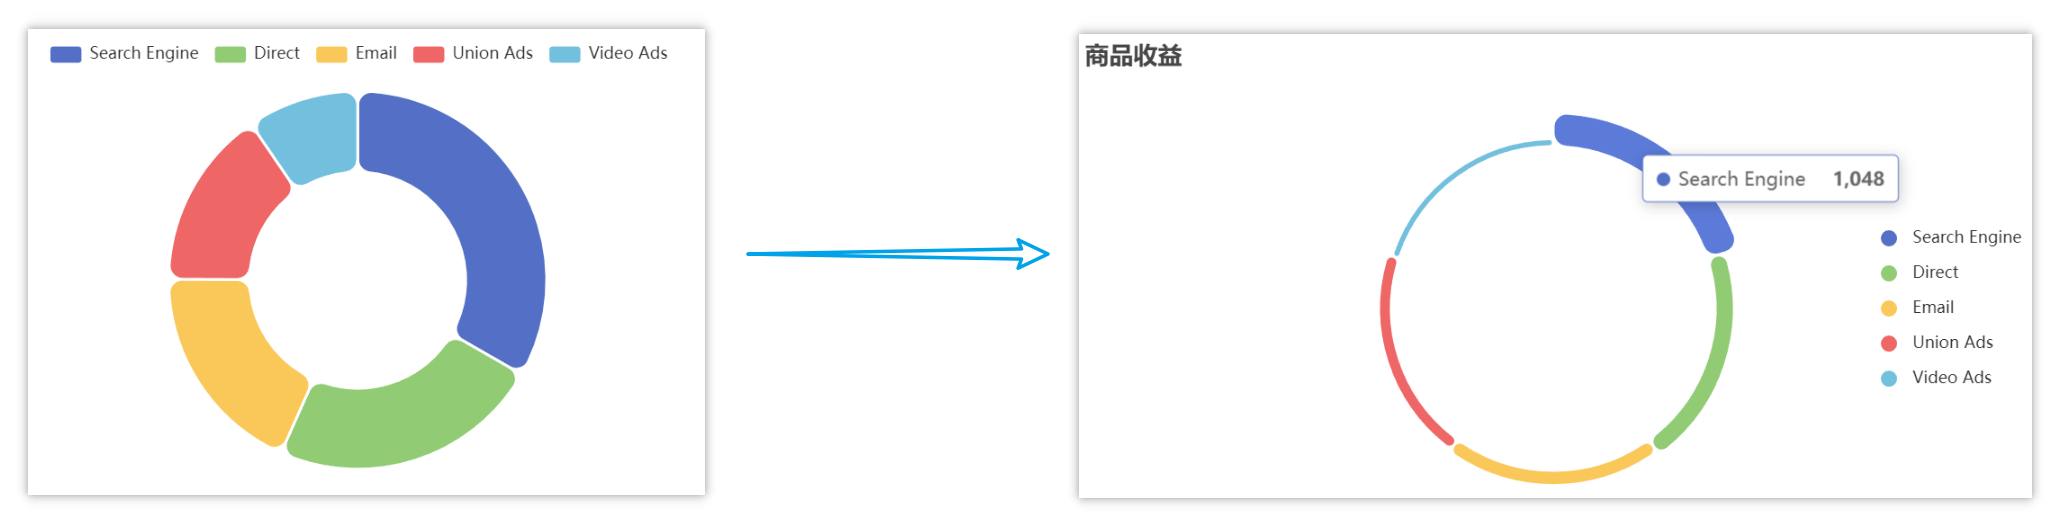
MyPie.vue 初始代码如下:
<template> <div> <div class="charts"> <div id="comPie" style="height: 400px; width: 44em" /> </div> </div> </template> <script> export default { name: 'myPie', data () { return { pieOption : { tooltip: { trigger: 'item' }, legend: { top: '5%', left: 'center' }, series: [ { name: 'Access From', type: 'pie', radius: ['40%', '70%'], avoidLabelOverlap: false, itemStyle: { borderRadius: 10, borderColor: '#fff', borderWidth: 2 }, label: { show: false, position: 'center' }, emphasis: { label: { show: true, fontSize: 40, fontWeight: 'bold' } }, labelLine: { show: false }, data: [ { value: 1048, name: 'Search Engine' }, { value: 735, name: 'Direct' }, { value: 580, name: 'Email' }, { value: 484, name: 'Union Ads' }, { value: 300, name: 'Video Ads' } ] } ] }, } }, mounted () { this.showPie() }, methods: { showPie () { // 指定 echarts 图表初始化的容器 const pieCharts = this.$echarts.init(document.querySelector('#comPie')) // 渲染 echarts pieCharts.setOption(this.pieOption, true) }, }, } </script> <style scoped type="text/less"> #channelPie { margin-top: 1em; } button { width: 80px; height: 30px; border: 1px solid #2a69ee; border-radius: 5px; font: normal normal 14px 微软雅黑; color: #2a69ee; background-color: white; } .charts { display: flex; justify-content: center; } </style> -
App.vue 原始代码
<template> <div id="app"> <myPie msg="Welcome to Your Vue.js App"/> </div> </template> <script> import myPie from './components/MyPie.vue' export default { name: 'App', components: { myPie } } </script> <style> </style> -
初始页面
1.2. 后端
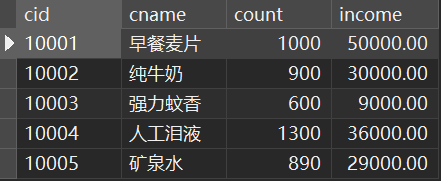
postgreSQL 表数据:
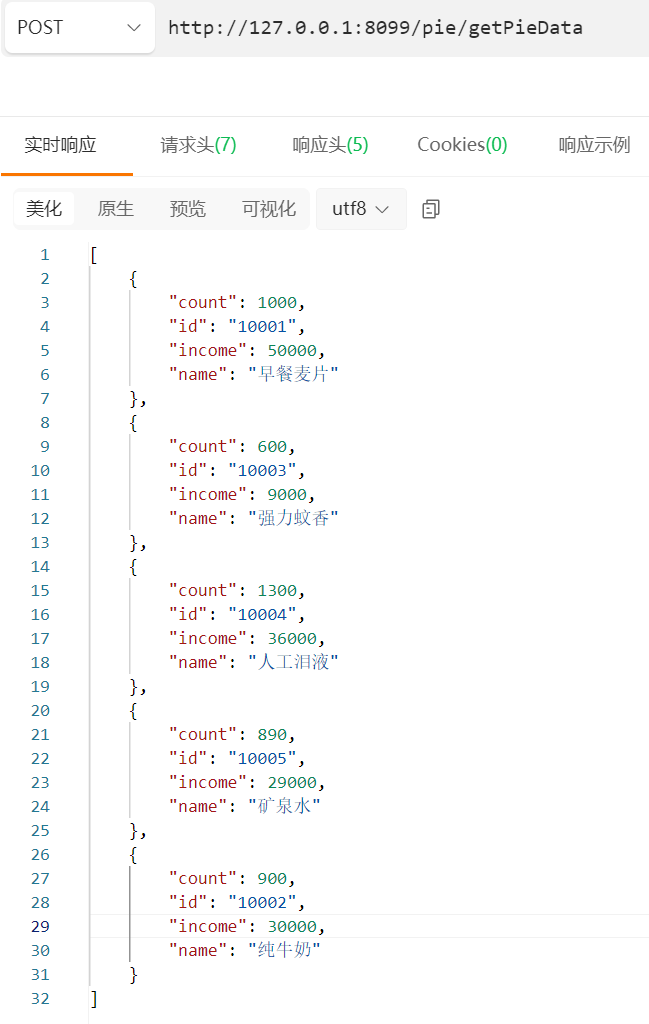
后端接口:http://127.0.0.1:8099/pie/getPieData
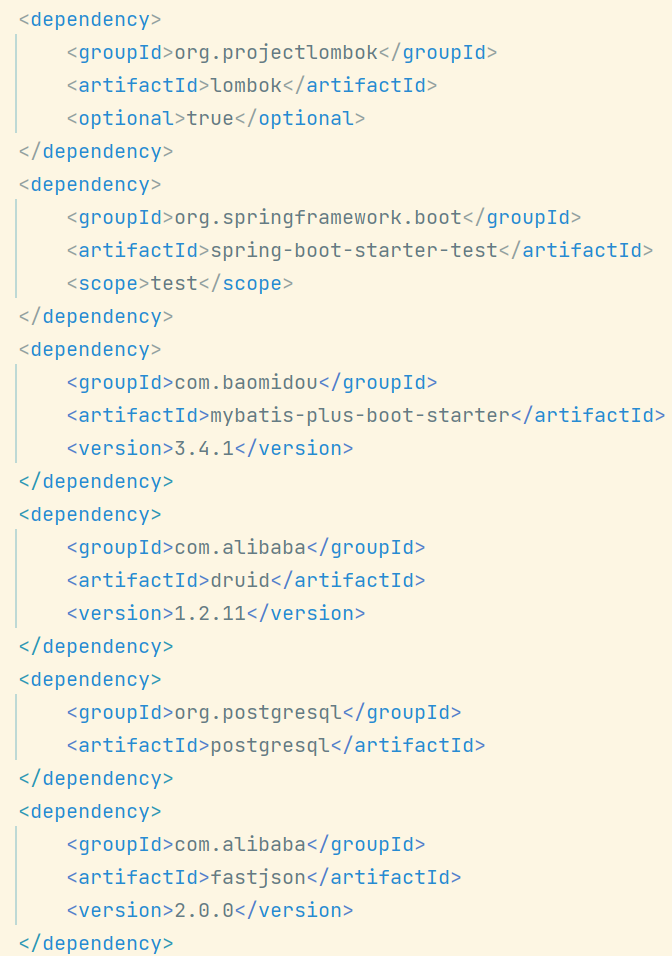
依赖:
application.yml
spring:
 datasource:
   type: com.alibaba.druid.pool.DruidDataSource
   url: jdbc:postgresql://localhost:5432/study?useUnicode=true&characterEncoding=UTF-8&useSSL=false
   username: postgres
   password: admin
   driver-class-name: org.postgresql.Driver
server:
 port: 8099
PieReadMapper.java
@Repository
public interface PieReadMapper extends BaseMapper<Commodity> {


}
Commodity.java 实体类
@TableName("t_commodity")
@Data
public class Commodity {


    @TableId("cid")
    private String id;
    @TableField("cname")
    private String name;
    private Integer count;
    private BigDecimal income;
}
PieController.java
@Slf4j
@RestController
@RequestMapping("/pie")
public class PieController {


    @Resource
    private PieReadMapper pieReadMapper;


    @PostMapping("getPieData")
    public JSONArray getPieData(String param) {


        log.info("前端参数===>{}", param);
//        QueryWrapper<Commodity> wrapper = new QueryWrapper<>();
//        wrapper.setEntity(new Commodity());
        List<Commodity> commodities = pieReadMapper.selectList(null);
        String s = JSONObject.toJSONString(commodities);
        return JSONArray.parseArray(s);
    }
}
PieBackApplication.java 启动类
@MapperScan("com.chenjy.pie_back.mapper.**")
@SpringBootApplication
public class PieBackApplication {


    public static void main(String[] args) {


        SpringApplication.run(PieBackApplication.class, args);
    }

}
2. 后端数据渲染前端
2.1 补充1:在 vue 中使用 axios
-
引入依赖
npm install axios -
main.js 全局引入 axios
import axios from 'axios' Vue.prototype.$axios = axios -
使用 axios 发送 post 请求
      getPieData() {


        const url = 'http://127.0.0.1:8099/pie/getPieData'
        this.$axios({


            method: 'post',
            url: url,
            data: null
        }).then(res => {


            console.log(res.data)
        }, err => {


            console.log('错误信息:', err.message)
        })
      }
那如何用 axios 发送 GET 请求呢?如下:
      testGet() {


        const url = 'http://127.0.0.1:8099/pie/testGet'
        this.$axios({


            // method: 'get', 默认 get,可不写
            url: url,
            params: {


                str: '前端发起一次 get 请求'
            }
        }).then(res => {


            console.log(res.data)
        }, err => {


            console.log('错误信息:', err.message)
        })
      }
2.2. 补充2:Springboot 处理跨域问题
-
解决跨域问题

在后台新加一个配置类@Configuration public class config implements WebMvcConfigurer { @Override public void addCorsMappings(CorsRegistry registry) { registry.addMapping("/**") .allowedOriginPatterns("*") .allowCredentials(true) .allowedMethods("GET", "POST", "DELETE", "PUT", "PATCH") .maxAge(3600); } }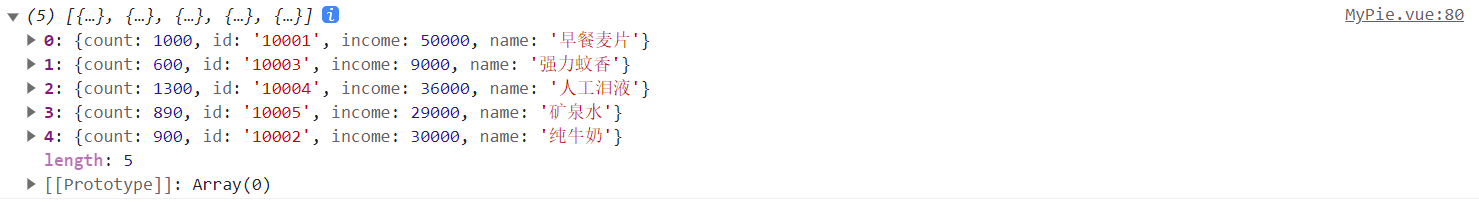
2.3. 修改前端代码
2.3.1 修改饼图样式
假数据先不去掉,后续把方法加上了再去掉。
        pieOption : {


            title: {


                show: true,
                text: '商品收益',
                x: 'left',
                y: 'top'
            },
            tooltip: {


                trigger: 'item'
            },
            legend: {


                orient: 'vertical',
                x: 'right',
                y: 'center',
                align: 'left',
                icon: 'circle',
            },
            series: [
                {


                type: 'pie',
                radius: ['60%', '70%'],
                roseType: 'area',
                avoidLabelOverlap: false,
                itemStyle: {


                    borderRadius: 10,
                    borderColor: '#fff',
                    borderWidth: 2
                },
                label: {


                    show: false,
                    position: 'center'
                },
                labelLine: {


                    show: false
                },
                data: [
                    {

     value: 1048, name: 'Search Engine' },
                    {

     value: 735, name: 'Direct' },
                    {

     value: 580, name: 'Email' },
                    {

     value: 484, name: 'Union Ads' },
                    {

     value: 300, name: 'Video Ads' }
                ]
                }
            ]
            },
      }
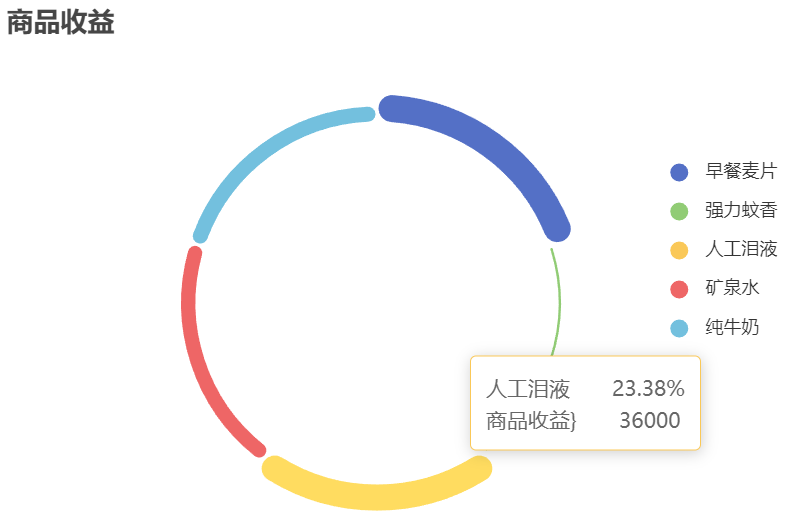
2.3.2 调用后台数据渲染饼图
<template>
<div>
<div class="charts">
<div id="comPie" style="height: 400px; width: 44em" />
</div>
</div>
</template>
<script>
export default {
name: 'myPie',
data () {
return {
pieOption : {
title: {
show: true,
text: '商品收益',
left: 100,
},
tooltip: {
trigger: 'item',
formatter: '{b}  {d}% <br> 商品收益}  {c}',
},
legend: {
orient: 'vertical',
right: 80,
top: 100,
align: 'left',
icon: 'circle',
data:[],
},
series: [
{
type: 'pie',
radius: ['60%', '70%'],
roseType: 'area',
avoidLabelOverlap: false,
itemStyle: {
borderRadius: 10,
borderColor: '#fff',
borderWidth: 2
},
label: {
show: false,
position: 'center'
},
labelLine: {
show: false
},
data: []
}
]
},
}
},
mounted () {
this.getPieData()
},
methods: {
// 每次给饼图传入新的数据之后都要调用这个函数来重新渲染饼图
showPie () {
// 指定 echarts 图表初始化的容器
const pieCharts = this.$echarts.init(document.querySelector('#comPie'))
// 渲染 echarts
pieCharts.setOption(this.pieOption, true)
},
// 调用后台获取饼图数据,并重新渲染饼图
getPieData() {
const url = 'http://127.0.0.1:8099/pie/getPieData'
this.$axios({
method: 'post',
url: url,
data: null
}).then(res => {
const datas = res.data
this.setPieData(datas)
this.showPie()
}, err => {
console.log('错误信息:', err.message)
})
},
// 根据传入数据给饼图参数赋值
setPieData(datas) {
// 根据 arrays 配置 option 的 legend 和 series.data 的数据
const data = Array.from(datas)
const legendArr = []
const seriesArr = []
for (let i = 0; i < data.length; i++) {
const seriesObj = {
}
legendArr.push(data[i].name)
seriesObj.value = data[i].income
seriesObj.name = data[i].name
seriesArr.push(seriesObj)
}
this.pieOption.legend.data = legendArr
this.pieOption.series[0].data = seriesArr
}
},
}
</script>
<style scoped type="text/less">
#channelPie {
margin-top: 1em;
}
button {
width: 80px;
height: 30px;
border: 1px solid #2a69ee;
border-radius: 5px;
font: normal normal 14px 微软雅黑;
color: #2a69ee;
background-color: white;
}
.charts {
display: flex;
justify-content: center;
}
</style>
2.3.3 改造成内外两个圈
如果要弄成内外两个圈的饼图,可以在 series 中再加一个数组:
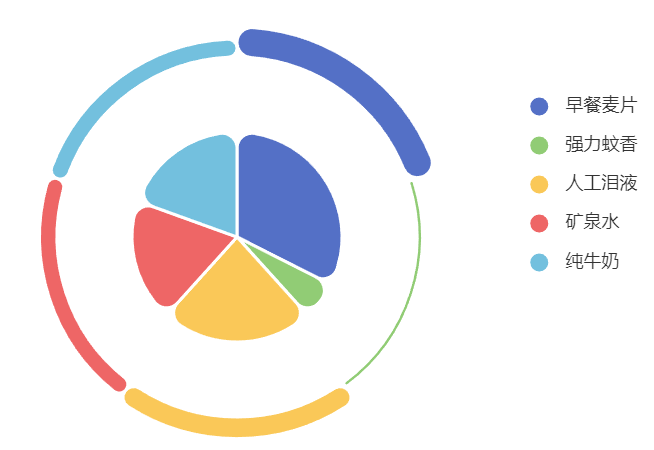
series: [
                {


                name: '商品收益',
                type: 'pie',
                radius: ['60%', '70%'],
                roseType: 'area',
                avoidLabelOverlap: false,
                itemStyle: {


                    borderRadius: 10,
                    borderColor: '#fff',
                    borderWidth: 2
                },
                label: {


                    show: false,
                    position: 'center'
                },
                labelLine: {


                    show: false
                },
                data: []
                },
                {


                name: '商品收益',
                type: 'pie',
                radius: '35%',
                // roseType: 'area',
                avoidLabelOverlap: false,
                itemStyle: {


                    borderRadius: 10,
                    borderColor: '#fff',
                    borderWidth: 2
                },
                label: {


                    show: false,
                    position: 'center'
                },
                labelLine: {


                    show: false
                },
                data: []
                }
            ]
            },
      setPieData(datas) {


        // 根据 arrays 配置 option 的 legend 和 series.data 的数据
        const data = Array.from(datas)
        const legendArr = []
        const seriesArr = []
        for (let i = 0; i < data.length; i++) {


           const seriesObj = {

    }
           legendArr.push(data[i].name)
           seriesObj.value = data[i].income
           seriesObj.name = data[i].name
           seriesArr.push(seriesObj)
        }