解决vue3+echarts关于无法获取dom宽度和高度的问题
近期写vue3项目,很多地方都用到了echarts,刚开始写的时候,发现图一直出不来,报错/报警内容一般有两项:
- Uncaught (in promise) Error: Initialize failed: invalid dom.
- vue3 [ECharts] Can’t get DOM width or height.
分别解释一下这俩报错
第一个报错是在初始化echarts的时候,没有找到对应的dom元素,所以需要在dom元素渲染完成后再初始化echarts图
第二个报错是说不能获取到echarts对应dom的宽或高,这个问题一般出现在设置dom节点的宽和高时,用了百分比形式,ECharts的宽高默认是以像素为单位的,并不能直接使用百分比来设置
经过多次尝试,总算解决这个问题了,记录一下解决方案
先上代码:
<template>
  <div class="right">
    <div class="top">
      <div class="top-left" ref="topLeft"></div>
      <div class="top-right" ref="topRight"></div>
    </div>
    <div class="middle" ref="middle"></div>
    <div class="bottom">
      <div class="bottom-left" ref="bottomLeft"></div>
      <div class="bottom-right" ref="bottomRight"></div>
    </div>
  </div>
</template>

<script setup>
import * as echarts from "echarts";
import {

     ref, onMounted } from 'vue'
import {

     driverAgeLT, driverAgeRT, driverAgeMiddle, driverAgeBL, driverAgeBR } from './graphOptions.js'

const topLeft = ref(null)
const LTOptions = driverAgeLT()
const drawLTchart = () => {


  const topLeftChart = echarts.init(topLeft.value)
  topLeftChart.setOption(LTOptions)
  topLeftChart.resize()
  window.addEventListener('resize', () => {


    topLeftChart.resize()
  })
}

const topRight = ref(null)
const RTOptions = driverAgeRT()
const drawRTchart = () => {


  const topRightChart = echarts.init(topRight.value)
  topRightChart.setOption(RTOptions)
  topRightChart.resize()
  window.addEventListener('resize', () => {


    topRightChart.resize()
  })
}

const middle = ref(null)
const middleOptions = driverAgeMiddle()
const drawMiddleChart = () => {


  const midddleChart = echarts.init(middle.value)
  midddleChart.setOption(middleOptions)
  midddleChart.resize()
  window.addEventListener('resize', () => {


    midddleChart.resize()
  })
}

const bottomLeft = ref(null)
const BLOptions = driverAgeBL()
const drawBLchart = () => {


  const bottomLeftChart = echarts.init(bottomLeft.value)
  bottomLeftChart.setOption(BLOptions)
  bottomLeftChart.resize()
  window.addEventListener('resize', () => {


    bottomLeftChart.resize()
  })
}

const bottomRight = ref(null)
const BROptions = driverAgeBR()
const drawBRchart = () => {


  const bottomRightChart = echarts.init(bottomRight.value)
  bottomRightChart.setOption(BROptions)
  bottomRightChart.resize()
  window.addEventListener('resize', () => {


    bottomRightChart.resize()
  })
}

onMounted(() => {


  setTimeout(() => {


    drawLTchart()
    drawRTchart()
    drawMiddleChart()
    drawBLchart()
    drawBRchart()
  }, 200)
})
</script>

<style lang="scss" scoped>
.right {


  width: 49%;
  margin-left: 10px;
  height: 99%;
  display: flex;
  flex-direction: column;
  padding: 10px;
  box-shadow: rgba(0, 0, 0, 0.05) 0px 6px 24px 0px, rgba(0, 0, 0, 0.08) 0px 0px 0px 1px;

  .top {


    height: 33%;
    display: flex;
    box-shadow: rgba(0, 0, 0, 0.05) 0px 0px 0px 1px, rgb(209, 213, 219) 0px 0px 0px 1px inset;

    .top-left {


      width: 50%;
      padding: 5px;
      height: 100%;
      border-right: 1px dashed #ccc;
    }

    .top-right {


      width: 50%;
      padding: 5px;
      height: 100%;
    }
  }

  .middle {


    margin-top: 5px;
    height: 33%;
    padding: 5px;
    width: 100%;
    box-shadow: rgba(0, 0, 0, 0.05) 0px 0px 0px 1px, rgb(209, 213, 219) 0px 0px 0px 1px inset;
  }

  .bottom {


    height: 33%;
    margin-top: 5px;
    display: flex;
    box-shadow: rgba(0, 0, 0, 0.05) 0px 0px 0px 1px, rgb(209, 213, 219) 0px 0px 0px 1px inset;

    .bottom-left {


      width: 50%;
      padding: 5px;
      height: 100%;
      border-right: 1px dashed #ccc;
    }

    .bottom-right {


      width: 50%;
      padding: 5px;
      height: 100%;
    }
  }
}
</style>
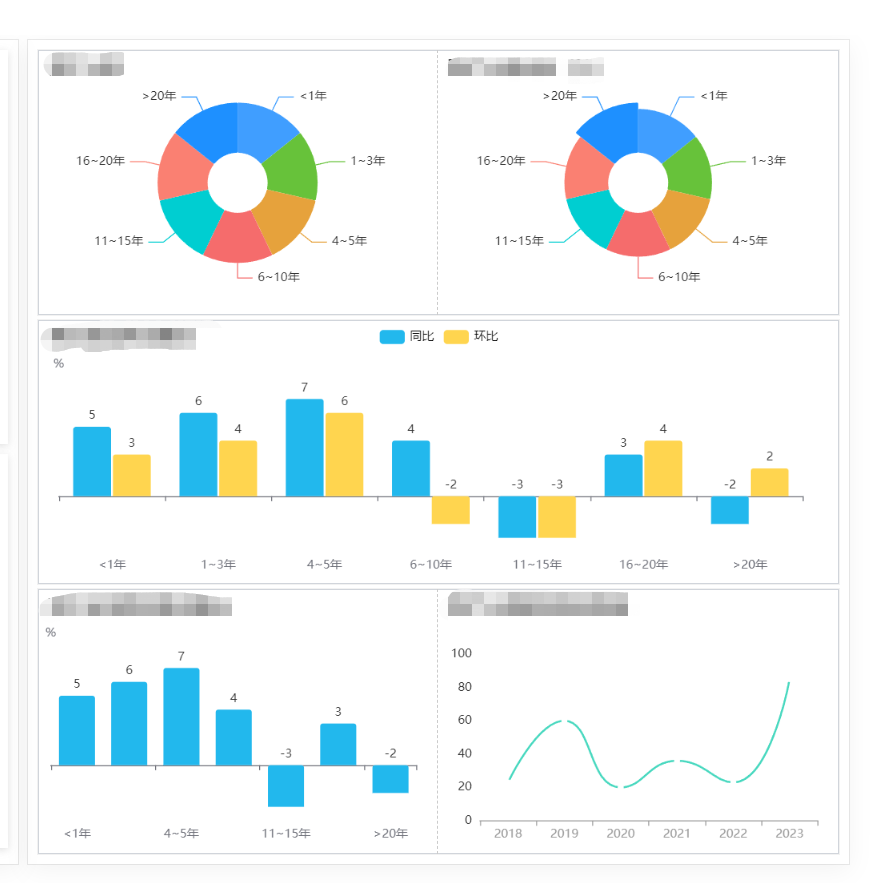
效果

代码我只放了图的那一部分,代码的作用是在页面的右侧画5张图,从我写的样式可以看出,所有画图的dom我都用了百分比,这样有个好处,不管什么屏幕,都可以比较好的显示,但是echarts并不支持百分比的宽高,所以狂报警
接下来解释一下代码:
-
import { driverAgeLT, driverAgeRT, driverAgeMiddle, driverAgeBL, driverAgeBR } from './graphOptions.js'这行代码是我把5张图的options都放到一个js文件里了,也是组件式开发的一个体现,这个文件我就不放上了,想怎么画图自己去设置 -
下面这几行代码是关键,我直接通过注释的形式来解释
const topLeft = ref(null)  // 获取dom
const LTOptions = driverAgeLT()  // 获取对应的options
const drawLTchart = () => {

        // 画图函数,为啥要写成函数,因为需要在页面加载完成后调用,要放在生命周期函数中
  const topLeftChart = echarts.init(topLeft.value)  // 初始化echarts图,注意,这里的topLeft是响应式的dom,必须要加value,这里我经常忘记
  topLeftChart.setOption(LTOptions)  // 设置option
  topLeftChart.resize()  // 这里也比较关键,在option后,最好是重绘一下图,可以解决百分比宽高的问题,也就是解决第2个问题
  window.addEventListener('resize', () => {

        // 窗口大小变化后,重绘图
    topLeftChart.resize()
  })
}

onMounted(() => {

        // vue3的生命周期函数,在页面加载完成后,再画图,其实就是解决第1个问题
  setTimeout(() => {

        // 这里为啥要用定时器在0.2s后再画图呢,其实我也不能确定是不是这个问题,但是这么写后,确实解决了问题,
    drawLTchart()     // 续上:页面加载完成后,dom不一定渲染完成了,所以这里的定时器是为了让dom渲染后再绘图
    drawRTchart()
    drawMiddleChart()
    drawBLchart()
    drawBRchart()
  }, 200)
})
这样就解决了上面两个问题了
不过还有个问题得说一下,很明显,我用了elementplus作为UI框架,我特别喜欢el-card这个组件,所以很多时候我都用它来做布局,但是我在用的时候,发现我很难掌握它的布局规律,尤其是在结合echarts画图的时候,各种dom相关的问题层出不穷,所以我不得不放弃使用el-card,二是自己用div来做布局。其实也就是个盒子阴影的问题,不会设计?当然不用自己造轮子,放一下各种花式的边框阴影~
完,希望所有bug退散~