问题描述
一台机器,n个工件,机器一次只能加工一个工件,求最优方案。
| 工件 | A | B | C | D | E | F | G | H | I |
|---|---|---|---|---|---|---|---|---|---|
| 工件编号 | 0 | 1 | 2 | 3 | 4 | 5 | 6 | 7 | 8 |
| 加工时间 | 4 | 7 | 6 | 5 | 8 | 3 | 5 | 5 | 10 |
| 到达时间 | 3 | 2 | 4 | 5 | 3 | 2 | 1 | 8 | 6 |
| 交货期 | 10 | 15 | 30 | 24 | 14 | 13 | 20 | 18 | 10 |
目标函数
最小化交货期总延时时间
运算结果
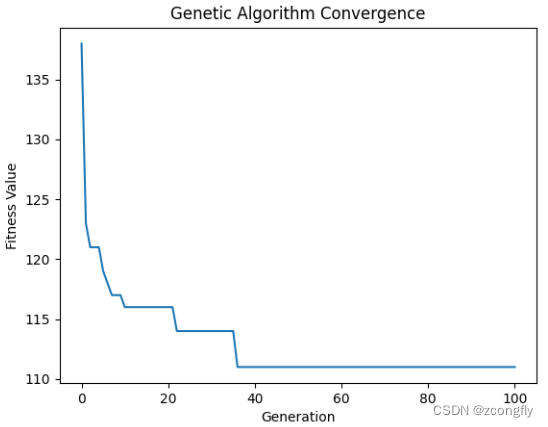
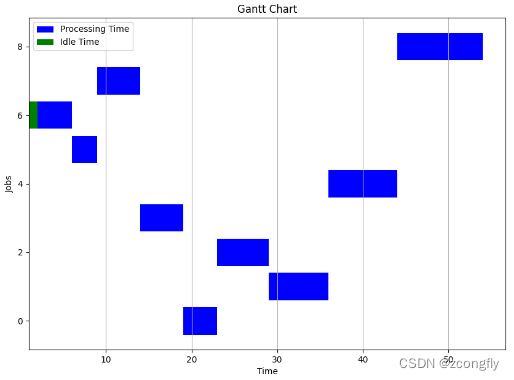
最佳调度顺序: [6, 5, 7, 3, 0, 2, 1, 4, 8]
最小交货期延时时间: 111
python代码
import math
import random
import numpy as np
import matplotlib.pyplot as plt

# 定义遗传算法参数
POP_SIZE = 100  # 种群大小
MAX_GEN = 100  # 最大迭代次数
CROSSOVER_RATE = 0.7  # 交叉概率
MUTATION_RATE = 0.2  # 变异概率


# 随机生成初始种群
def gen_init_pop(pop_size):
    population = []
    for _ in range(pop_size):
        random.shuffle(job)
        population.append(list(job))
    return population


# 计算染色体的适应度(makespan) 以最小化交货期延时为目标函数,这里计算的是交货期总延时时间
def fitness(job):
    n = len(job)
    accu_pro_times = [0] * n  # 累计加工时间
    accu_pro_times[0] = pro_times[job[0]] + arr_times[job[0]]
    for i in range(1, n):
        accu_pro_times[i] = pro_times[job[i]] + accu_pro_times[i - 1] if arr_times[job[i]] <= accu_pro_times[
            i - 1] else arr_times[job[i]] + pro_times[job[i]]
    delay_time = sum([max(accu_pro_times[i] - deadlines[i], 0) for i in range(n)])
    return delay_time


# 选择父代,这里选择POP_SIZE/2个作为父代
def selection(pop):
    fitness_values = [1 / fitness(job) for job in pop]  # 以最小化交货期总延时为目标函数,这里把最小化问题转变为最大化问题
    total_fitness = sum(fitness_values)
    prob = [fitness_value / total_fitness for fitness_value in fitness_values]  # 轮盘赌,这里是每个适应度值被选中的概率
    # 按概率分布prob从区间[0,len(pop))中随机抽取size个元素,不允许重复抽取,即轮盘赌选择
    selected_indices = np.random.choice(len(pop), size=POP_SIZE // 2, p=prob, replace=False)
    return [pop[i] for i in selected_indices]


# 交叉操作 这里是单点交叉
def crossover(job_p1, job_p2):
    cross_point = random.randint(1, len(job_p1) - 1)
    job_c1 = job_p1[:cross_point] + [gene for gene in job_p2 if gene not in job_p1[:cross_point]]
    job_c2 = job_p2[:cross_point] + [gene for gene in job_p1 if gene not in job_p2[:cross_point]]
    return job_c1, job_c2


# 变异操作
def mutation(job):
    index1, index2 = random.sample(range(len(job)), 2)
    job[index1], job[index2] = job[index2], job[index1]
    return job


# 主遗传算法循环
def GA():
    # 创建一个空列表来存储每代的适应度值
    best_job = job  # 获得最佳个体
    # "makespan" 是指完成整个生产作业或生产订单所需的总时间,通常以单位时间(例如小时或分钟)来衡量。
    best_makespan = fitness(job)  # 获得最佳个体的适应度值
    fitness_history = [best_makespan]

    pop = gen_init_pop(POP_SIZE)
    for _ in range(1, MAX_GEN + 1):
        pop = selection(pop)  # 选择
        new_population = []

        while len(new_population) < POP_SIZE:
            parent1, parent2 = random.sample(pop, 2)  # 不重复抽样2个
            if random.random() < CROSSOVER_RATE:
                child1, child2 = crossover(parent1, parent2)  # 交叉
                new_population.extend([child1, child2])
            else:
                new_population.extend([parent1, parent2])

        pop = [mutation(job) if random.random() < MUTATION_RATE else job for job in new_population]
        best_gen_job = min(pop, key=lambda x: fitness(x))
        best_gen_makespan = fitness(best_gen_job)  # 每一次迭代获得最佳个体的适应度值
        if best_gen_makespan < best_makespan:  # 更新最小fitness值
            best_makespan = best_gen_makespan
            best_job = best_gen_job
        fitness_history.append(best_makespan)  # 把本次迭代结果保存到fitness_history中(用于绘迭代曲线)
    # 绘制迭代曲线图
    plt.plot(range(MAX_GEN + 1), fitness_history)
    plt.xlabel('Generation')
    plt.ylabel('Fitness Value')
    plt.title('Genetic Algorithm Convergence')
    plt.show()

    return best_job, best_makespan


def plot_gantt(job, pro_times, arr_times):
    # 计算每个工件的开始时间和结束时间
    start_time = [arr_times[0]]  # 第一个工件的开始时间为0
    end_time = [start_time[0] + pro_times[0]]

    for i in range(1, len(job)):
        start_time.append(max(end_time[i - 1], arr_times[i]))
        end_time.append(start_time[i] + pro_times[i])

    # # 绘制甘特图
    plt.figure(figsize=(10, 7))
    plt.barh(job, pro_times, left=start_time, color='b', label='Processing Time')  # 加工时间
    plt.barh(job, [st - ed for st, ed in zip(start_time, [0] + end_time[:-1])], left=start_time,
             color='g', label='Idle Time')  # 空闲时间
    plt.xlabel('Time')
    plt.ylabel('Jobs')
    plt.title('Gantt Chart')
    plt.legend()
    plt.grid(axis='x')

    # 显示甘特图
    plt.show()


if __name__ == '__main__':
    # 定义单机调度问题的工件和加工时间
    job = [0, 1, 2, 3, 4, 5, 6, 7, 8]  # 工件
    pro_times = [4, 7, 6, 5, 8, 3, 5, 5, 10]  # 加工时间
    arr_times = [3, 2, 4, 5, 3, 2, 1, 8, 6]  # 到达时间
    deadlines = [10, 15, 30, 24, 14, 13, 20, 18, 10]  # 交货期

    best_job, best_makespan = GA()
    best_pro_times = [pro_times[best_job[i]] for i in range(len(best_job))]
    best_arr_times = [arr_times[best_job[i]] for i in range(len(best_job))]

    print("最佳调度顺序:", best_job)
    print("最小交货期延时时间:", best_makespan)
    plot_gantt(best_job, best_pro_times, best_arr_times)