概要
模板匹配是一种在图像处理领域广泛应用的技术,旨在寻找目标模板在源图像中的位置。该算法的核心思想是通过比较模板与源图像的局部区域,逐像素滑动,创建一个相似度图,反映了模板与源图像各位置的相似程度。
使用OpenCV库实现模板匹配,该过程类似于在卷积神经网络中使用卷积核的方式。
模板匹配的基本原理:
模板匹配的基本原理是在源图像上通过逐像素滑动的方式,将模板与源图像的每个部分进行比较。这相当于在图像上进行卷积操作,其中每个像素值表示了模板与源图像相应区域的相似性。这个过程生成了一个相似度图,通过分析该图,可以识别出峰值,这些峰值对应于源图像中与模板相匹配的位置。
OpenCV中的模板匹配实现:
在OpenCV中,模板匹配通过cv2.matchTemplate()函数实现。该函数采用源图像和模板图像作为输入,返回一个相似度图。通过分析相似度图,可以使用cv2.minMaxLoc()函数找到最大匹配值的位置,从而确定模板在源图像中的位置。
相似性度量的选择:
模板匹配的实现可能基于不同的相似性度量方法,例如平方差匹配、相关性匹配或归一化互相关匹配。选择适当的相似性度量方法取决于具体的应用场景和需求。
整体架构流程
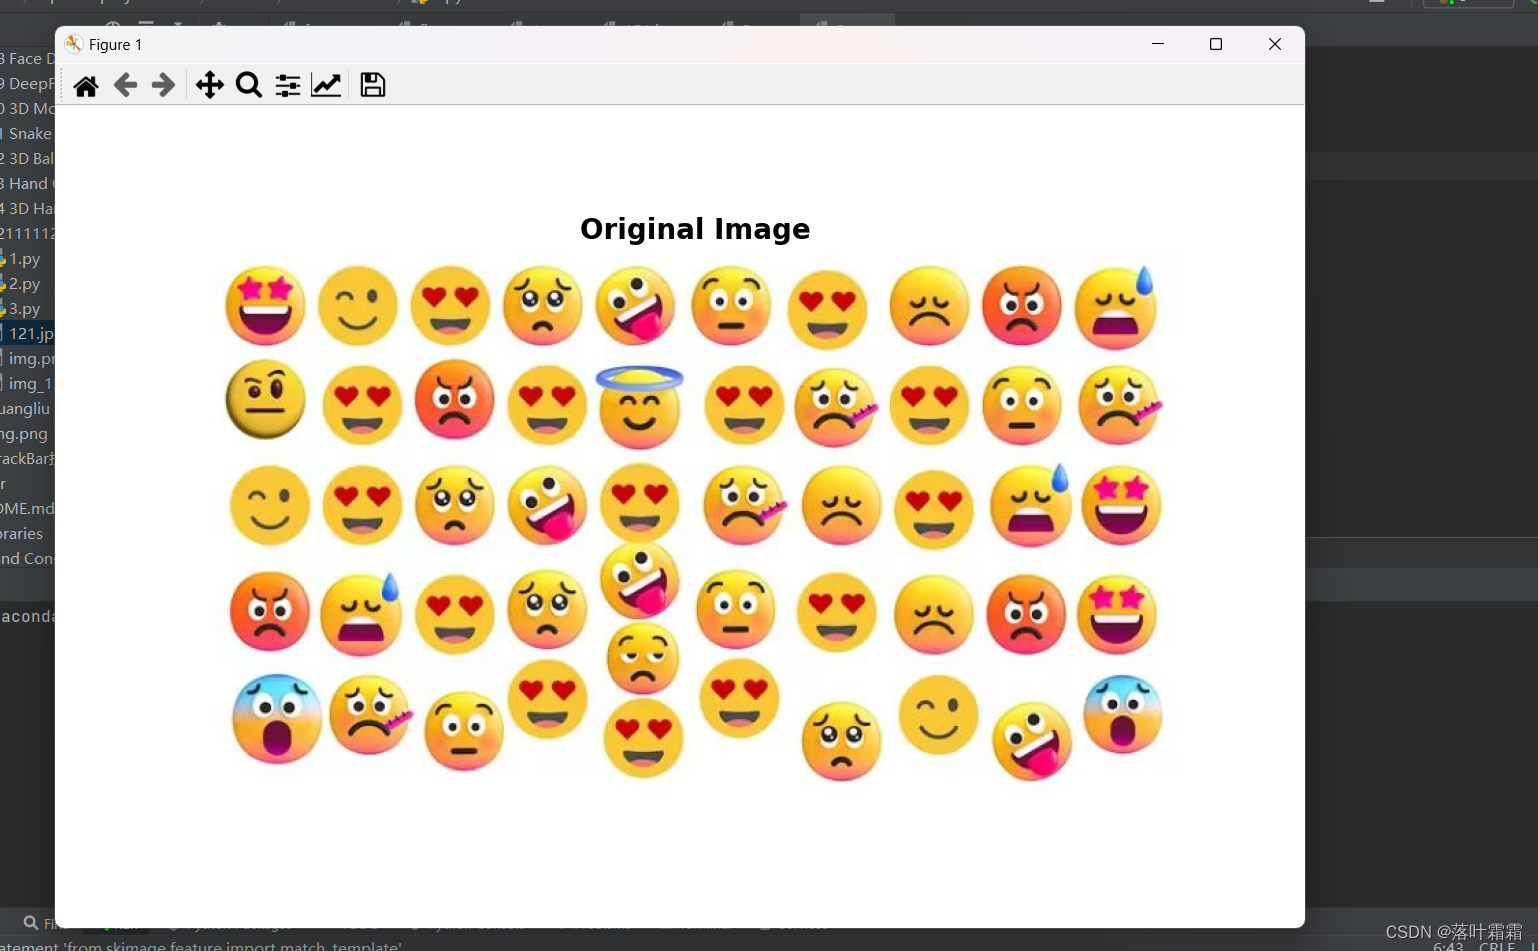
首先导入原图像并且显示出来:
# Import libraries
import numpy as np
import matplotlib.pyplot as plt
from skimage.io import imread, imshow
from skimage.color import rgb2gray
from skimage.feature import match_template
from skimage.feature import peak_local_max

# Load the original image
original_image = imread('121.jpg')

# Show the original image with a smaller window
plt.figure(figsize=(10, 10))
plt.imshow(original_image)
plt.title('Original Image', fontsize=16, weight='bold')
plt.axis('off')
plt.show()
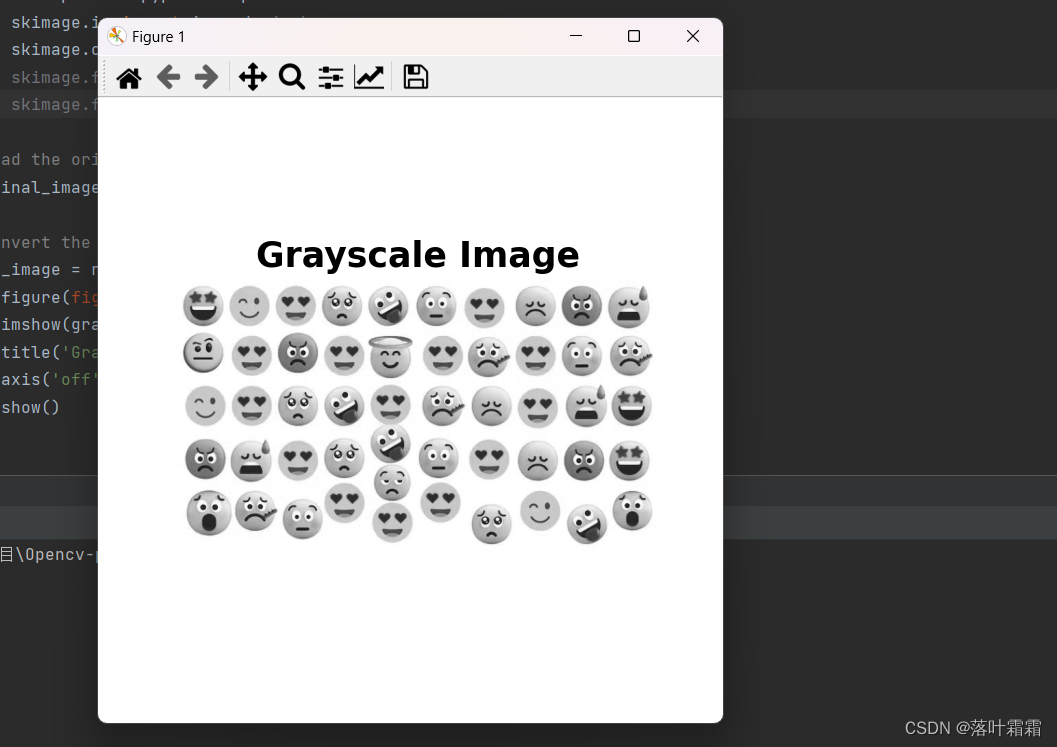
图像灰度化
虽然模板匹配适用于彩色图像,但让我们简化并将图像转换为灰度图来减少计算量。
这个可以调节窗口大小:
改(5,5)即可
plt.figure(figsize=(5,5))
# Import libraries
import numpy as np
import matplotlib.pyplot as plt
from skimage.io import imread, imshow
from skimage.color import rgb2gray
from skimage.feature import match_template
from skimage.feature import peak_local_max

# Load the original image
original_image = imread('121.jpg')

# Convert the image to grayscale
gray_image = rgb2gray(original_image[:,:,:3])
plt.figure(figsize=(5,5))
plt.imshow(gray_image, cmap='gray')
plt.title('Grayscale Image', fontsize=20, weight='bold')
plt.axis('off')
plt.show()
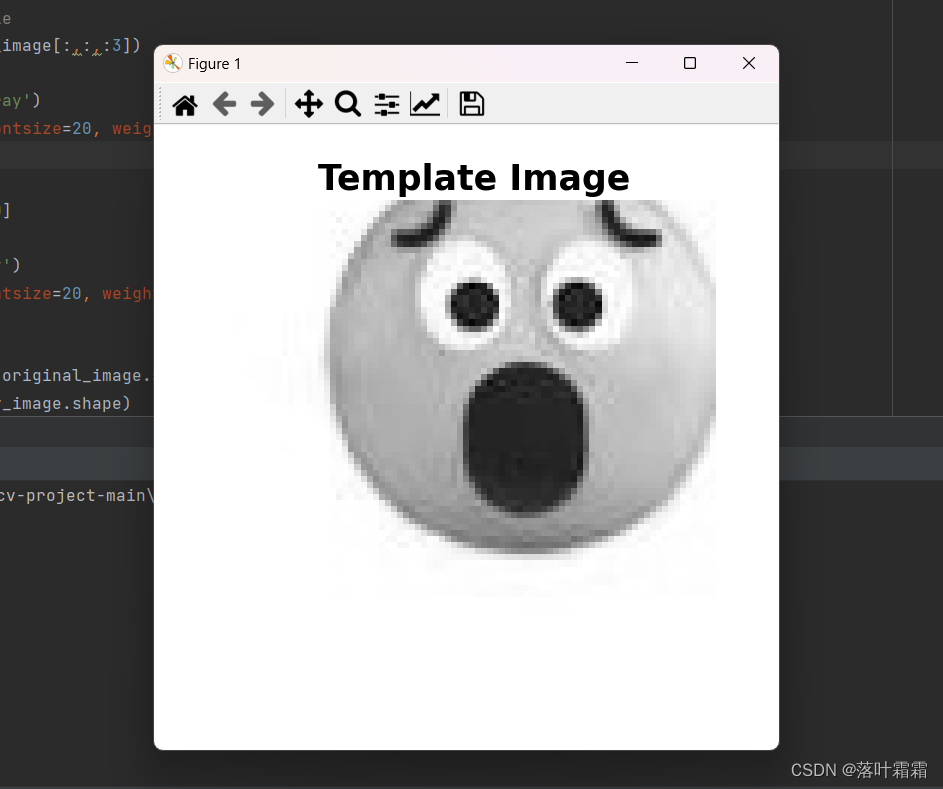
加载模板
现在,让我们从灰度图中截取一个心动的表情作为我们的目标模板,代码如下
# Import libraries
import numpy as np
import matplotlib.pyplot as plt
from skimage.io import imread, imshow
from skimage.color import rgb2gray
from skimage.feature import match_template
from skimage.feature import peak_local_max

# Load the original image
original_image = imread('121.jpg')

# Convert the image to grayscale
gray_image = rgb2gray(original_image[:,:,:3])
plt.figure(figsize=(10,10))
plt.imshow(gray_image, cmap='gray')
plt.title('Grayscale Image', fontsize=20, weight='bold')
plt.axis('off')
plt.show()
template = gray_image[:80, -80:]
plt.figure(figsize=(5,5))
plt.imshow(template, cmap='gray')
plt.title('Template Image', fontsize=20, weight='bold')
plt.axis('off')
plt.show();
print("Original image shape:", original_image.shape)
print("Gray image shape:", gray_image.shape)
print("Template shape:", template.shape)
取表情包的代码:template = gray_image[:80, -80:]
是指一个区域,这是最右上角的表情
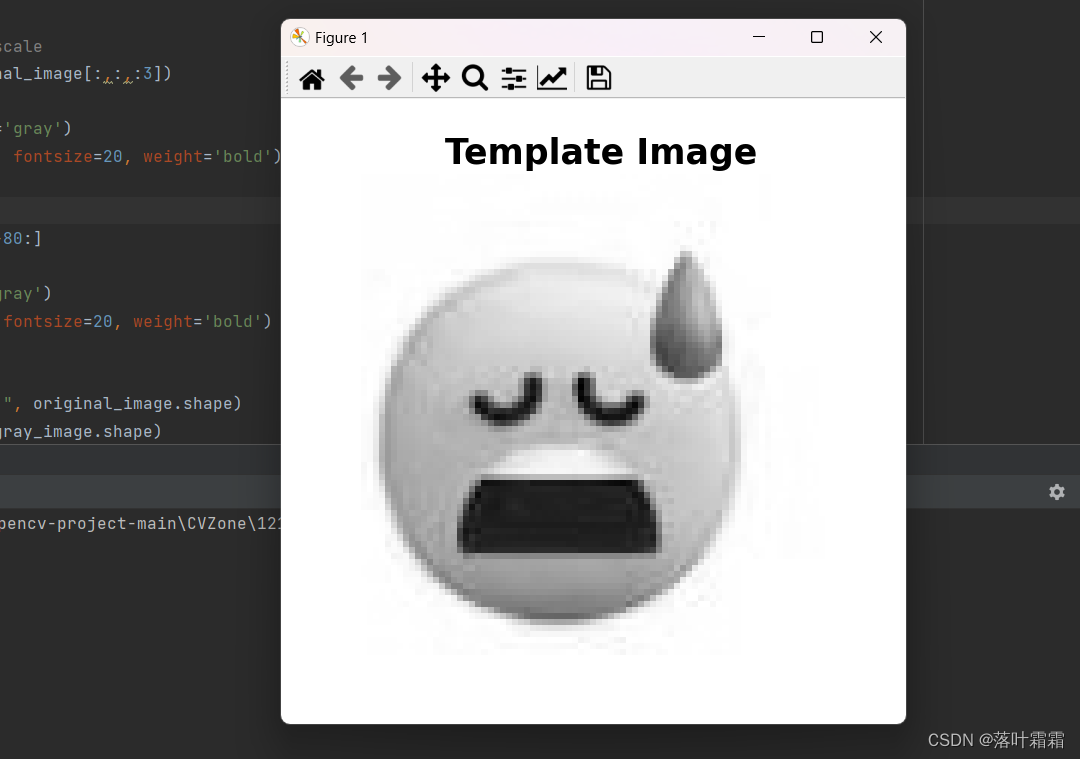
这个是最左下角,可以自行适当调整。
template = gray_image[-80:, :80]
模板匹配
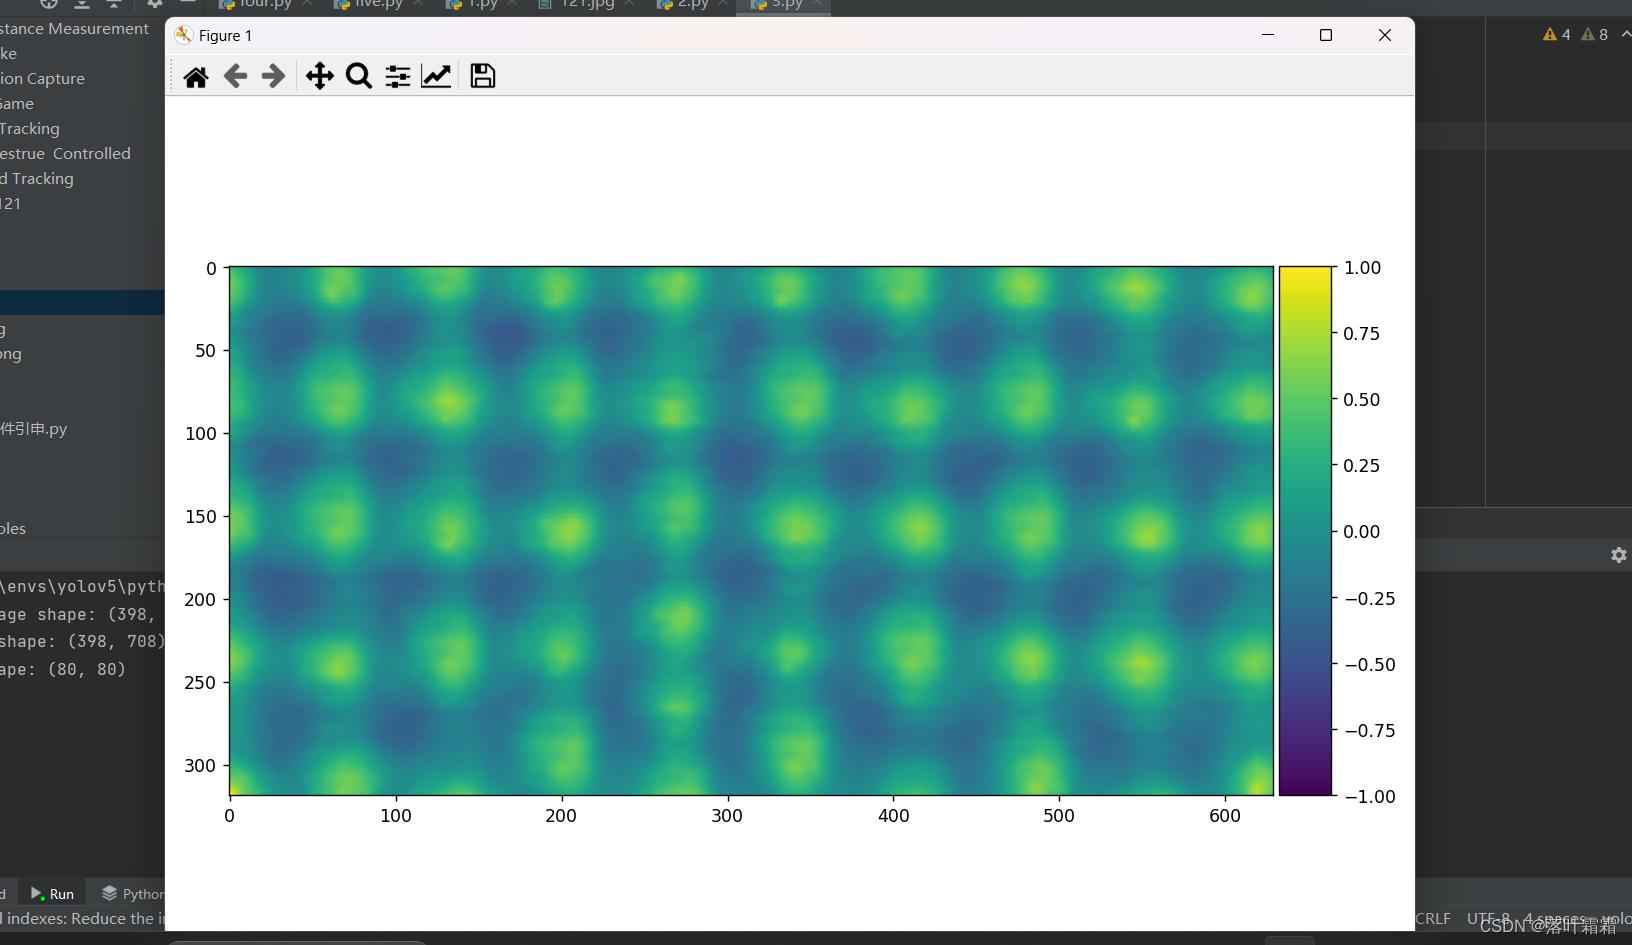
通过使用 skimage库中的match_template函数 , 我们可以得到衡量模板图和原图的相似度的热力图,如下:
result = match_template(gray_image, template)
plt.figure(figsize=(10,10))
imshow(result, cmap='viridis')
plt.show();
全部代码:
# Import libraries
import numpy as np
import matplotlib.pyplot as plt
from skimage.io import imread, imshow
from skimage.color import rgb2gray
from skimage.feature import match_template
from skimage.feature import peak_local_max
# Load the original image
original_image = imread('121.jpg')
# Convert the image to grayscale
gray_image = rgb2gray(original_image[:,:,:3])
plt.figure(figsize=(10,10))
plt.imshow(gray_image, cmap='gray')
plt.title('Grayscale Image', fontsize=20, weight='bold')
plt.axis('off')
plt.show()
# Define the template
template = gray_image[:80, -80:]
# Show the template
plt.figure(figsize=(5,5))
plt.imshow(template, cmap='gray')
plt.title('Template Image', fontsize=20, weight='bold')
plt.axis('off')
plt.show()
# Perform template matching
result = match_template(gray_image, template)
# Display the result
plt.figure(figsize=(10,10))
imshow(result, cmap='viridis')
plt.show()
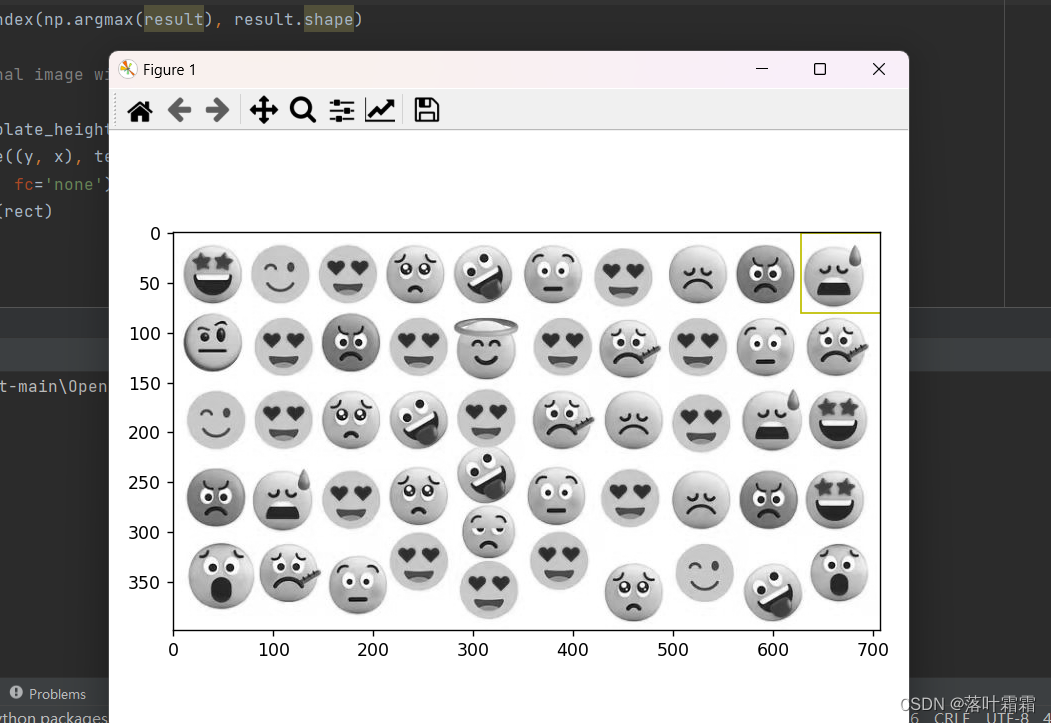
# Find the location of the template
x, y = np.unravel_index(np.argmax(result), result.shape)
# Display the original image with the rectangle around the matched region
imshow(gray_image)
template_width, template_height = template.shape
rect = plt.Rectangle((y, x), template_height, template_width, color='y',
fc='none')
plt.gca().add_patch(rect)
plt.show()
# Import libraries
import numpy as np
import matplotlib.pyplot as plt
from skimage.io import imread, imshow
from skimage.color import rgb2gray
from skimage.feature import match_template
from skimage.feature import peak_local_max

# Load the original image
original_image = imread('121.jpg')

# Convert the image to grayscale
gray_image = rgb2gray(original_image[:,:,:3])
plt.figure(figsize=(10,10))
plt.imshow(gray_image, cmap='gray')
plt.title('Grayscale Image', fontsize=20, weight='bold')
plt.axis('off')
plt.show()

# Define the template
template = gray_image[:80, -80:]

# Show the template
plt.figure(figsize=(5,5))
plt.imshow(template, cmap='gray')
plt.title('Template Image', fontsize=20, weight='bold')
plt.axis('off')
plt.show()

# Perform template matching
result = match_template(gray_image, template)

# Display the result
plt.figure(figsize=(10,10))
imshow(result, cmap='viridis')
plt.show()

# Set a threshold for peak detection
# Set a lower threshold for peak detection
threshold = 0.9

# Find the location of the template with peak_local_max
imshow(gray_image)
template_width, template_height = template.shape
for x, y in peak_local_max(result, threshold_abs=threshold):
    rect = plt.Rectangle((y, x), template_height, template_width, color='red',
                         fc='none')
    plt.gca().add_patch(rect)

plt.show()
可以设置阈值
threshold = 0.5
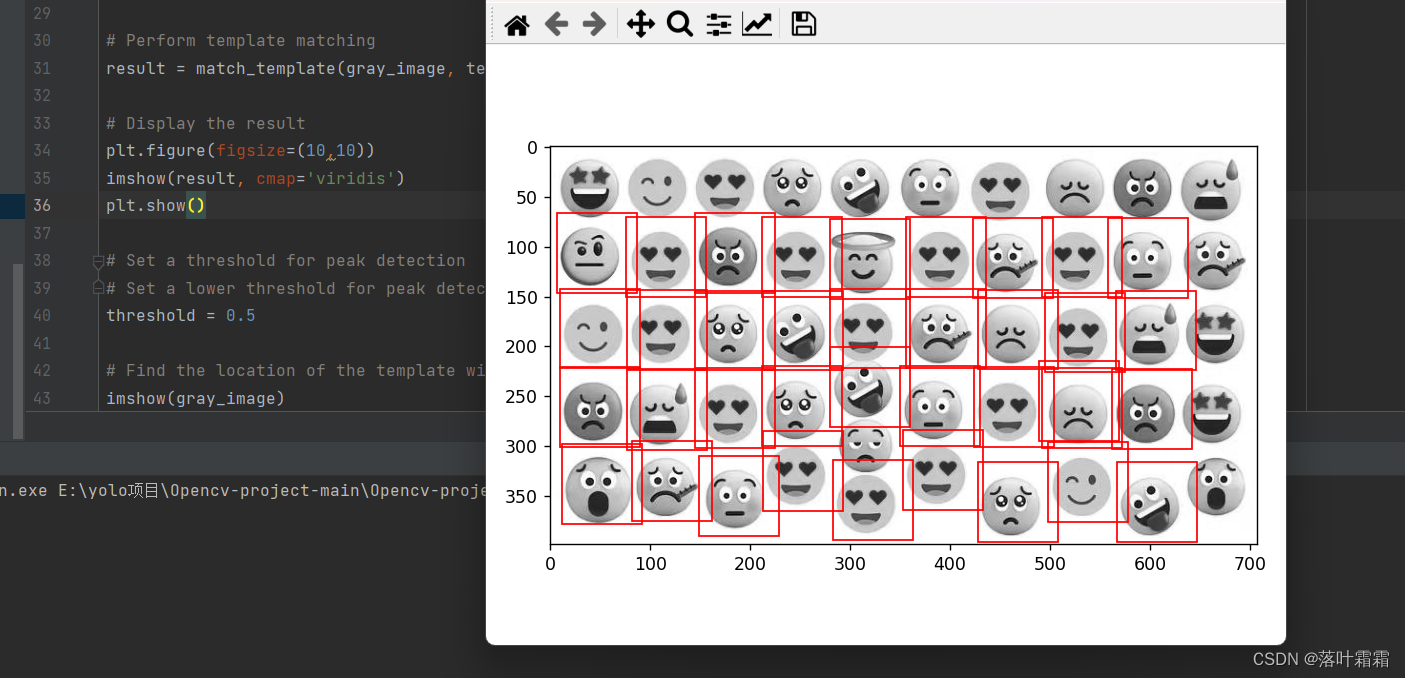
threshold = 0.9
至于最右上角的为什么识别不出来,是因为上面模板匹配找设置的时候,右边的笑脸框进去了,但是最右上角的没有左半边笑脸,就自动被排除在外了。
原图显示;
# Import libraries
import numpy as np
import matplotlib.pyplot as plt
from skimage.io import imread, imshow
from skimage.color import rgb2gray
from skimage.feature import match_template
from skimage.feature import peak_local_max
# Load the original image
original_image = imread('121.jpg')
# Convert the image to grayscale
gray_image = rgb2gray(original_image[:,:,:3])
plt.figure(figsize=(10,10))
plt.imshow(gray_image, cmap='gray')
plt.title('Grayscale Image', fontsize=20, weight='bold')
plt.axis('off')
plt.show()
# Define the template
template = gray_image[:80, -80:]
# Perform template matching
result = match_template(gray_image, template)
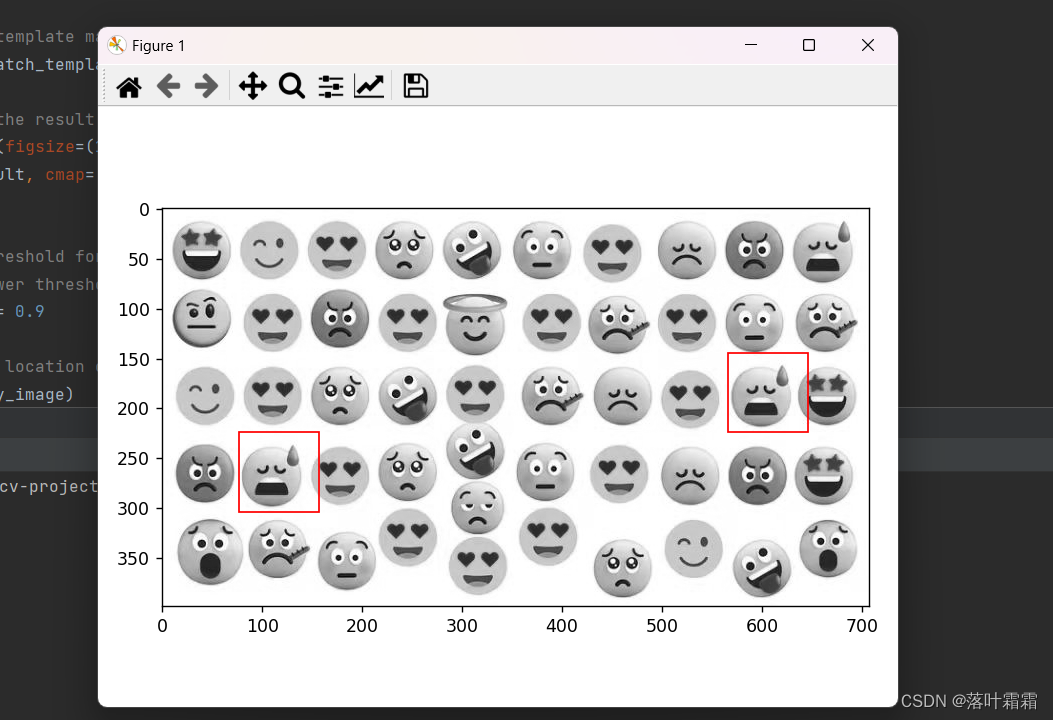
# Set a lower threshold for peak detection
threshold = 0.75
# Find the location of the template with peak_local_max
imshow(gray_image)
template_width, template_height = template.shape
for x, y in peak_local_max(result, threshold_abs=threshold):
rect = plt.Rectangle((y, x), template_height, template_width, color='red',
fc='none')
plt.gca().add_patch(rect)
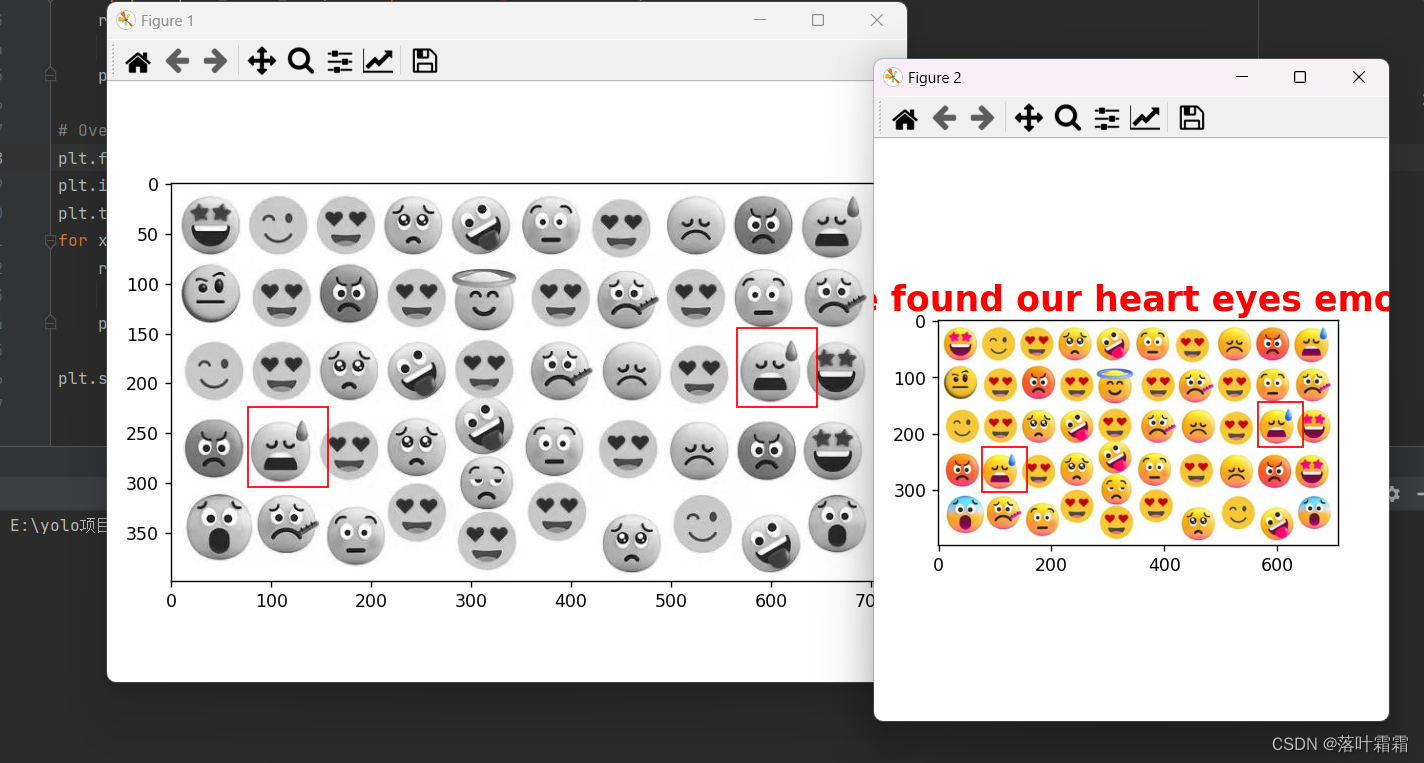
# Overlay the result on the original image
plt.figure(figsize=(20, 20))
plt.imshow(original_image)
plt.title('We found our heart eyes emojis!', fontsize=20, weight='bold', color='red')
for x, y in peak_local_max(result, threshold_abs=threshold):
rect = plt.Rectangle((y, x), template_height, template_width, color='red',
fc='none')
plt.gca().add_patch(rect)
plt.show()
结论
通过使用OpenCV进行模板匹配,我们可以有效地在图像中定位目标模板的位置。该方法广泛应用于目标检测、物体识别和图像分析等领域。在实际应用中,根据具体需求选择合适的相似性度量方法和调整算法参数,可以获得更精确的匹配结果。