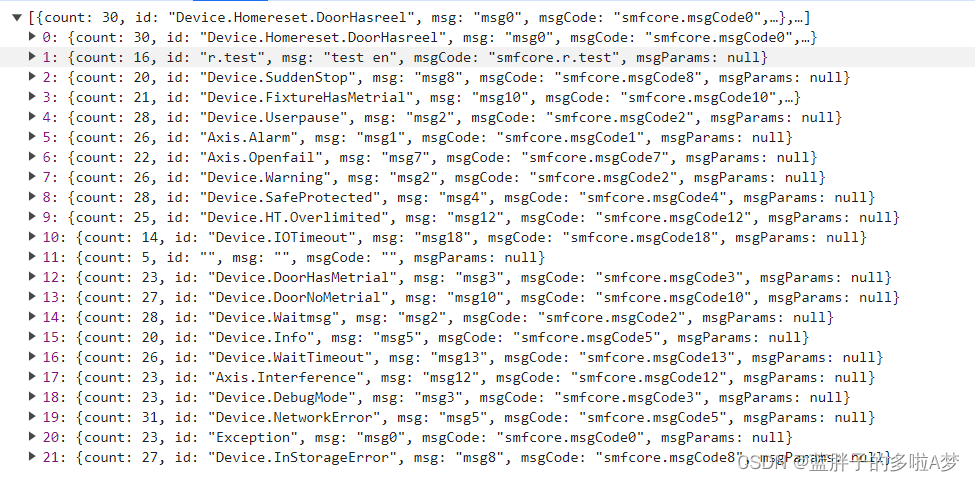
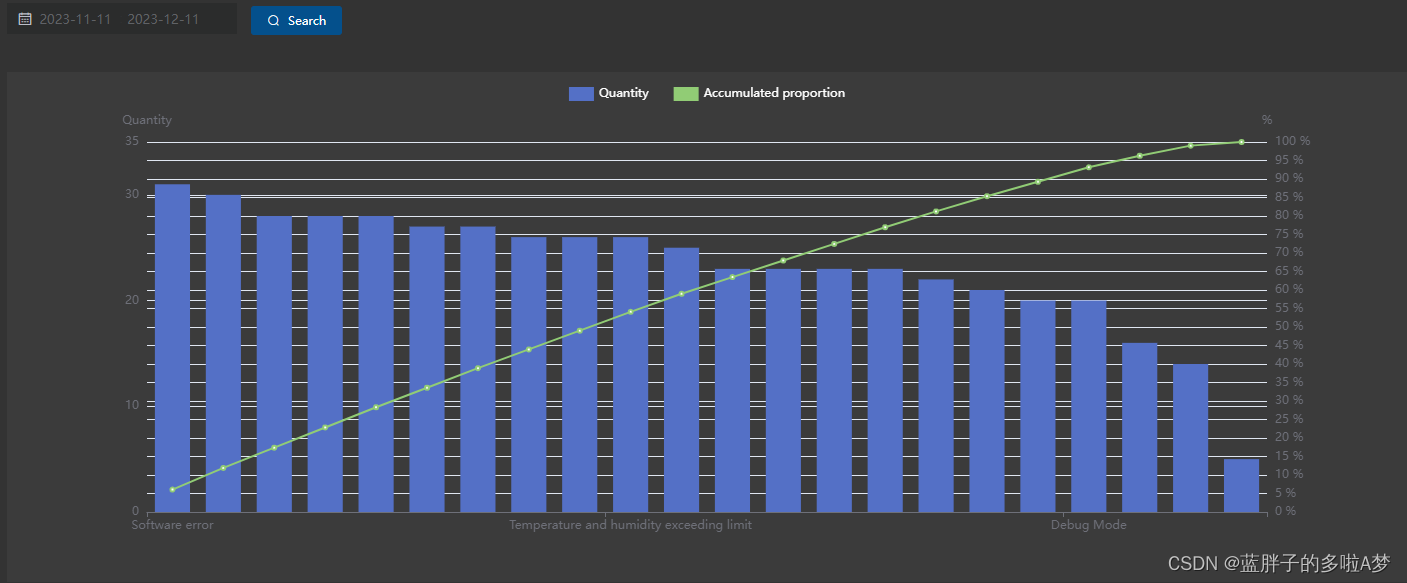
vue2+Echarts数据可视化 【帕累托图】

在这里插入图片描述

接口得到的数据如下

在这里插入图片描述
要经过排序 ,计算累计百分比得到数据

蓝色 柱状图数据: 取count字段值

横坐标:取 id值

折线图:根据柱状图的数据计算累计百分比

 getInterface(data) {
    
    
            getParetoChart(data).then((res) => {
    
    
                if (res) {
    
    
                    this.xList = res.map(item => {
    
    
                        return window.vm.$i18n.t(`MsgAlarmType.${
      
      item.id}`)
                    });
                    let data = res.map(item => {
    
    
                        return item.count
                    });
                    // 对数据进行排序
                    data.sort((a, b) => b - a);
                    this.countList = data
                    // 计算总和
                    const total = data.reduce((sum, value) => sum + value, 0);
                    // 计算累计百分比
                    let cumulativePercentage = 0;
                    this.percentList = data.map(value => {
    
    
                        const percentage = (value / total) * 100;
                        cumulativePercentage += percentage;
                        return cumulativePercentage.toFixed(2);
                    });


                }

            });
        },

完整代码

<template>
  <div class="bkChart">
       <date-range-picker v-model="deviceFormData.time" class="date-item"
                        :start-placeholder="$t('NeoLight.startTime')" :end-placeholder="$t('NeoLight.endTime')"
                        value-format="yyyy-MM-dd" @change="getList" />
       <lineChart :labelList="xList" :barValueList="countList" :lineValueList="percentList" />
  </div>
</template>
<script>
import lineChart from "../../../components/Echarts/paretoChart.vue";
import {
    
     getParetoChart } from "@/api/neolight/inventory";
export default {
    
    
    name: "paretoChart",
    components: {
    
     lineChart },
    data() {
    
    
        return {
    
    
          deviceFormData: {
    
    
                time: []
            },
            xList: [],// x轴,横坐标值
            countList: [],//柱状图数据
            percentList: [],//折线图数据,计算累计百分比
        };
    },
    mounted() {
    
    
    },
    methods: {
    
    
        getList() {
    
    
            let data = {
    
    
                createDate: this.deviceFormData.time,
            };
            this.getInterface(data)
        },
        getInterface(data) {
    
    
            getParetoChart(data).then((res) => {
    
    
                if (res) {
    
    
                    this.xList = res.map(item => {
    
    
                        return window.vm.$i18n.t(`MsgAlarmType.${
      
      item.id}`)
                    });
                    let data = res.map(item => {
    
    
                        return item.count
                    });

                    // 对数据进行排序
                    data.sort((a, b) => b - a);
                    this.countList = data
                    // 计算总和
                    const total = data.reduce((sum, value) => sum + value, 0);
                    // 计算累计百分比
                    let cumulativePercentage = 0;
                    this.percentList = data.map(value => {
    
    
                        const percentage = (value / total) * 100;
                        cumulativePercentage += percentage;
                        return cumulativePercentage.toFixed(2);
                    });
                }
            });
        },
    },
};
</script>

paretoChart.vue文件

<template>
    <div ref="Echart" id="myChart" :class="className" :style="{ height: height, width: width }" />
</template>
  
<script>
export default {
      
      
    props: {
      
      
        labelList: Array,
        barValueList: Array,
        lineValueList: Array,
        className: {
      
      
            type: String,
            default: "chart",
        },
        width: {
      
      
            type: String,
            default: "100%",
        },
        height: {
      
      
            type: String,
            default: "500px",
        },
    },
    data() {
      
      
        return {
      
      
            chart: null,
        };
    },
    watch: {
      
      
        labelList: {
      
      
            handler(newQuestion, oldQuestion) {
      
      
                this.labelList = newQuestion;
                this.initChart();

            },
            deep: true,
        },
        barValueList: {
      
      
            handler(newValue, oldValue) {
      
      
                this.barValueList = newValue;
                this.initChart();
            },
            deep: true,
        },
        lineValueList: {
      
      
            handler(newValue, oldValue) {
      
      
                this.lineValueList = newValue;
                this.initChart();
            },
            deep: true,
        },
    },
    mounted() {
      
      
        this.initChart();
        this.__resizeHandler = debounce(() => {
      
      
            if (this.chart) {
      
      
                this.chart.resize();
            }
        }, 100);
        window.addEventListener("resize", this.__resizeHandler);
    },

    methods: {
      
      
        initChart() {
      
      
            this.chart = this.$echarts.init(this.$refs.Echart);
            this.chart.setOption({
      
      
                tooltip: {
      
      
                    trigger: 'axis',
                    axisPointer: {
      
      
                        type: 'cross',
                        crossStyle: {
      
      
                            color: '#fff'
                        }
                    }
                },
                legend: {


                    left: "center", //图例距离整个容器左边
                    icon: "rect", //设置图例图标的形状为实心圆,这个不填,默认是矩形
                    itemGap: 25, //图例图标与文字间的间距
                    textStyle: {
      
      
                        fontSize: 12, //图例文字字体大小
                        color: "#ffffff", //图例文字颜色
                    },
                },
                xAxis: [
                    {
      
      
                        type: 'category',
                        data: this.labelList,
                        axisPointer: {
      
      
                            type: 'shadow'
                        },
                    }
                ],
                yAxis: [
                    {
      
      
                        type: 'value',
                        name: window.vm.$i18n.t('MsgAlarmType.amount'),
                        interval: 10,
                        axisLabel: {
      
      
                            formatter: '{value}'
                        }
                    },
                    {
      
      
                        type: 'value',
                        name: '%',
                        // min: 0,
                        // max: 25,
                        interval: 5,
                        axisLabel: {
      
      
                            formatter: '{value} %'
                        }
                    }
                ],
                series: [
                    {
      
      
                        name: window.vm.$i18n.t('MsgAlarmType.amount'),
                        type: 'bar',
                        tooltip: {
      
      
                            valueFormatter: function (value) {
      
      
                                return value
                            }
                        },
                        data: this.barValueList
                    },
                    {
      
      
                        name: window.vm.$i18n.t('MsgAlarmType.accPercent'),
                        type: 'line',
                        yAxisIndex: 1,
                        tooltip: {
      
      
                            valueFormatter: function (value) {
      
      
                                return value + '%';
                            }
                        },
                        data: this.lineValueList
                    }
                ]

            });
        },
    },
    beforeDestroy() {
      
      
        if (!this.chart) {
      
      
            return;
        }
        window.removeEventListener("resize", this.__resizeHandler);
        this.chart.dispose();
        this.chart = null;
    },
};
</script>

参考页面链接:https://blog.csdn.net/qq_36752532/article/details/122074267

猜你喜欢

转载自blog.csdn.net/Maxueyingying/article/details/134922486